Application Map Feature in the Application Insights
- Print
- DarkLight
- PDF
Application Map Feature in the Application Insights
- Print
- DarkLight
- PDF
Article summary
Did you find this summary helpful?
Thank you for your feedback!
One of the essential tools that would help you get more data and insights about your Azure API Management instance is Application Insights. Of course, we can't cover everything related to Application Insights monitoring in one article; however, we will focus on the Application Map feature in the Application Insights in this article.
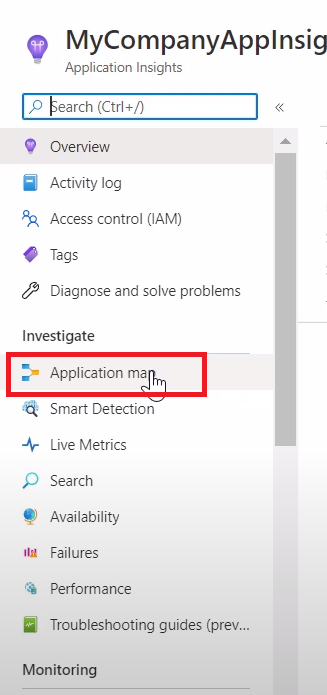
You can view The Application Map inside Application Insight instance from here.
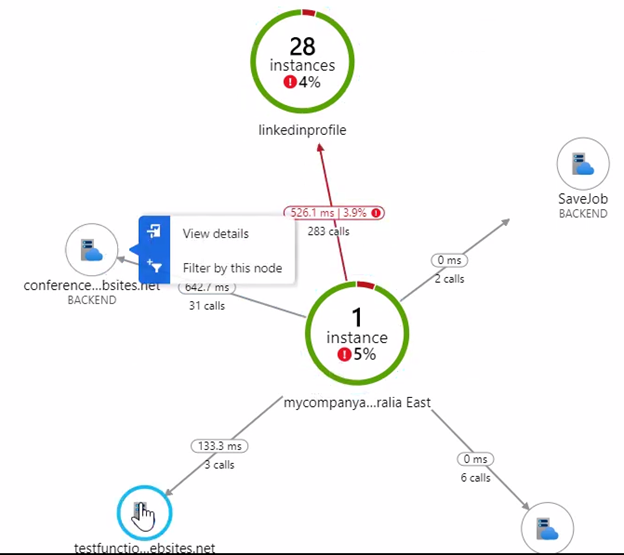
As you can see, you'll get a graphical representation of different components of your API Management and their APIs. In addition to the number of calls and the average response time.
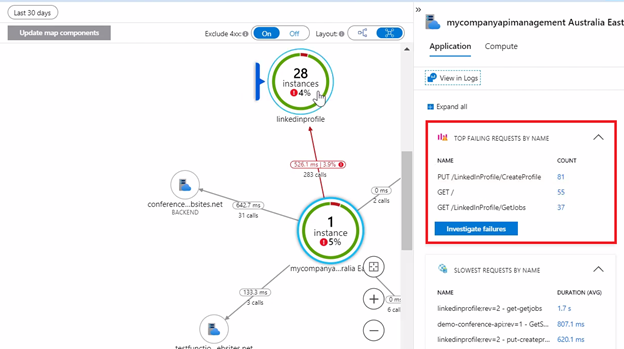
By focusing on the API Management instance, you will get more detailed information like the top failing requests and slowest requests run through your API Management instance.
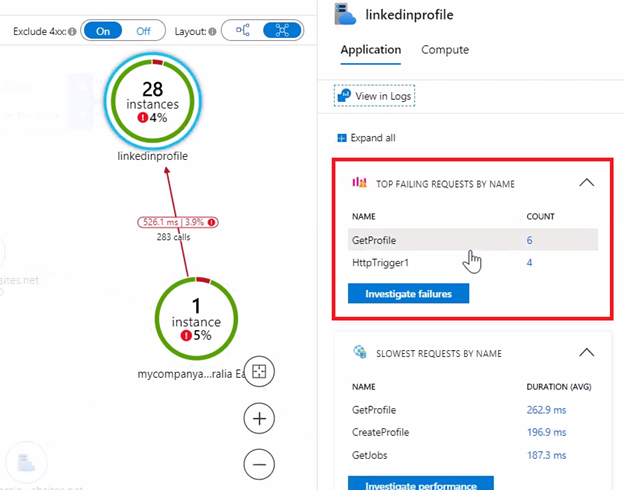
And, when you click on a specific API, you should get the same detailed information scoped to your selected API only.
It's important to mention that all data presented by Application Map exists in a way or another in other API Management analytics. However, you can view them in a different representation that would work best for your support team. It would be easier for them to master one monitoring tool (like Application Insights) and know it inside out to get any information they need straight away. Rather than teaching them how to work with different Azure services and it's going to be time-consuming for your support team.
Was this article helpful?