Analyse and Troubleshooting Azure Functions with KUDU
- Print
- DarkLight
- Download PDF
Analyse and Troubleshooting Azure Functions with KUDU
- Print
- DarkLight
- Download PDF
Article summary
Did you find this summary helpful?
Thank you for your feedback!
#ServerlessTips - Azure Functions
Author: Steef-Jan Wiggers Azure MVP
Once you have deployed your functions in a Function App and they have executed a couple of times, you can observe logging information in Application Insights, the monitor tab (for each function), and KUDU for analysis and troubleshooting.
To access the KUDU console, you need your Azure credentials, and navigate to https://****.scm.azurewebsites.net, where **** is the name of your Function App. Note you can also get access through the platform feature in the portal by clicking the Advanced tools (KUDU).
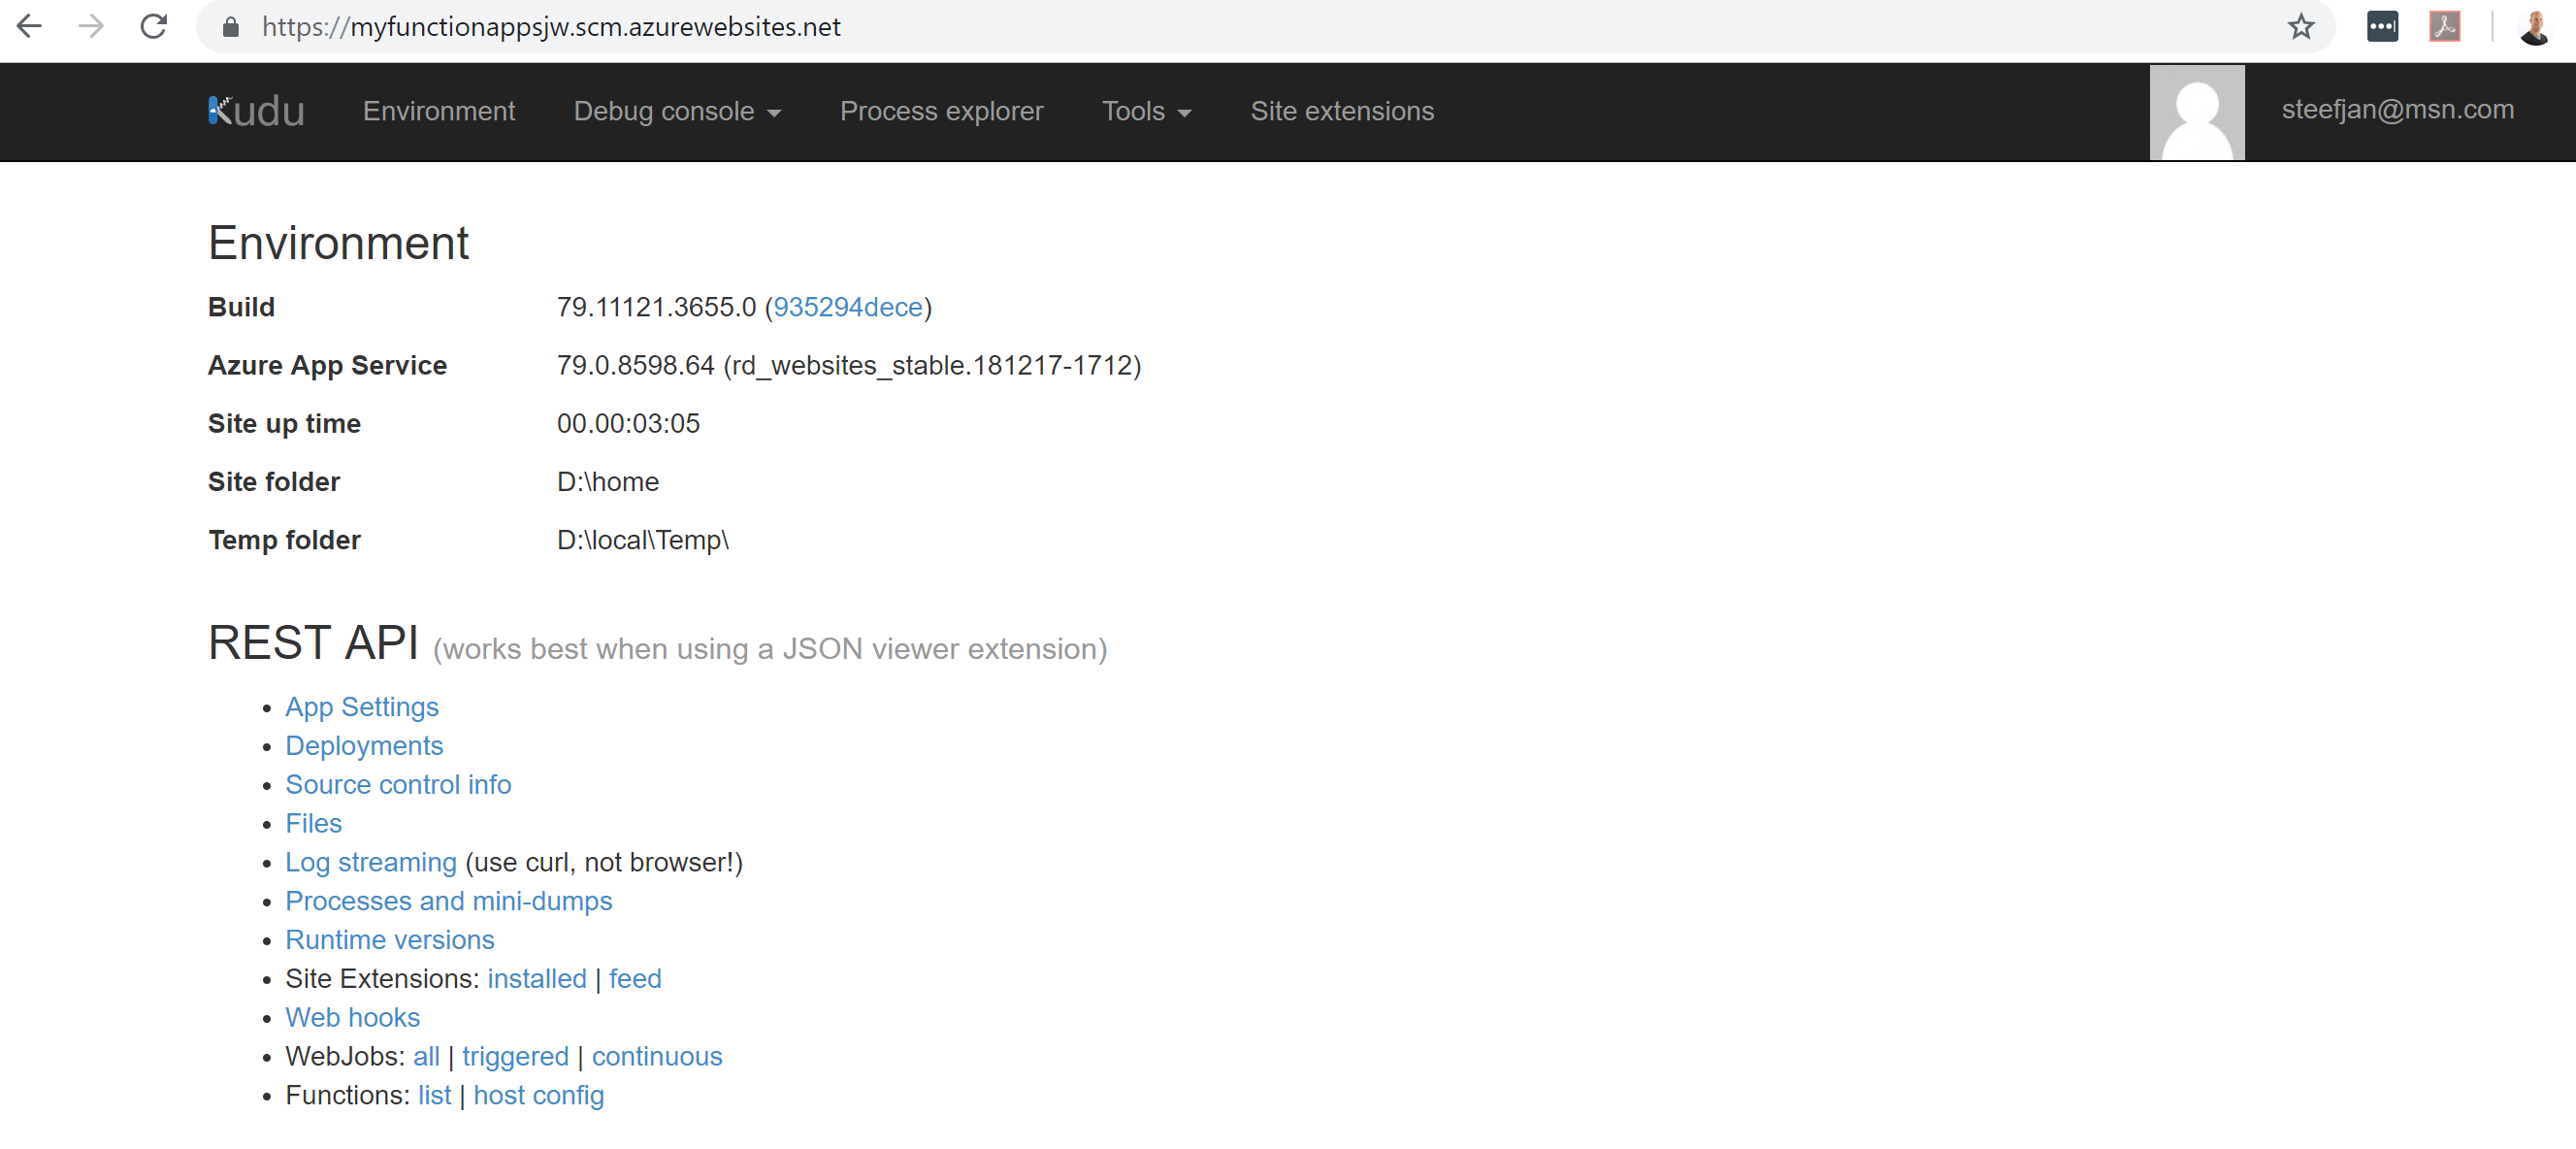
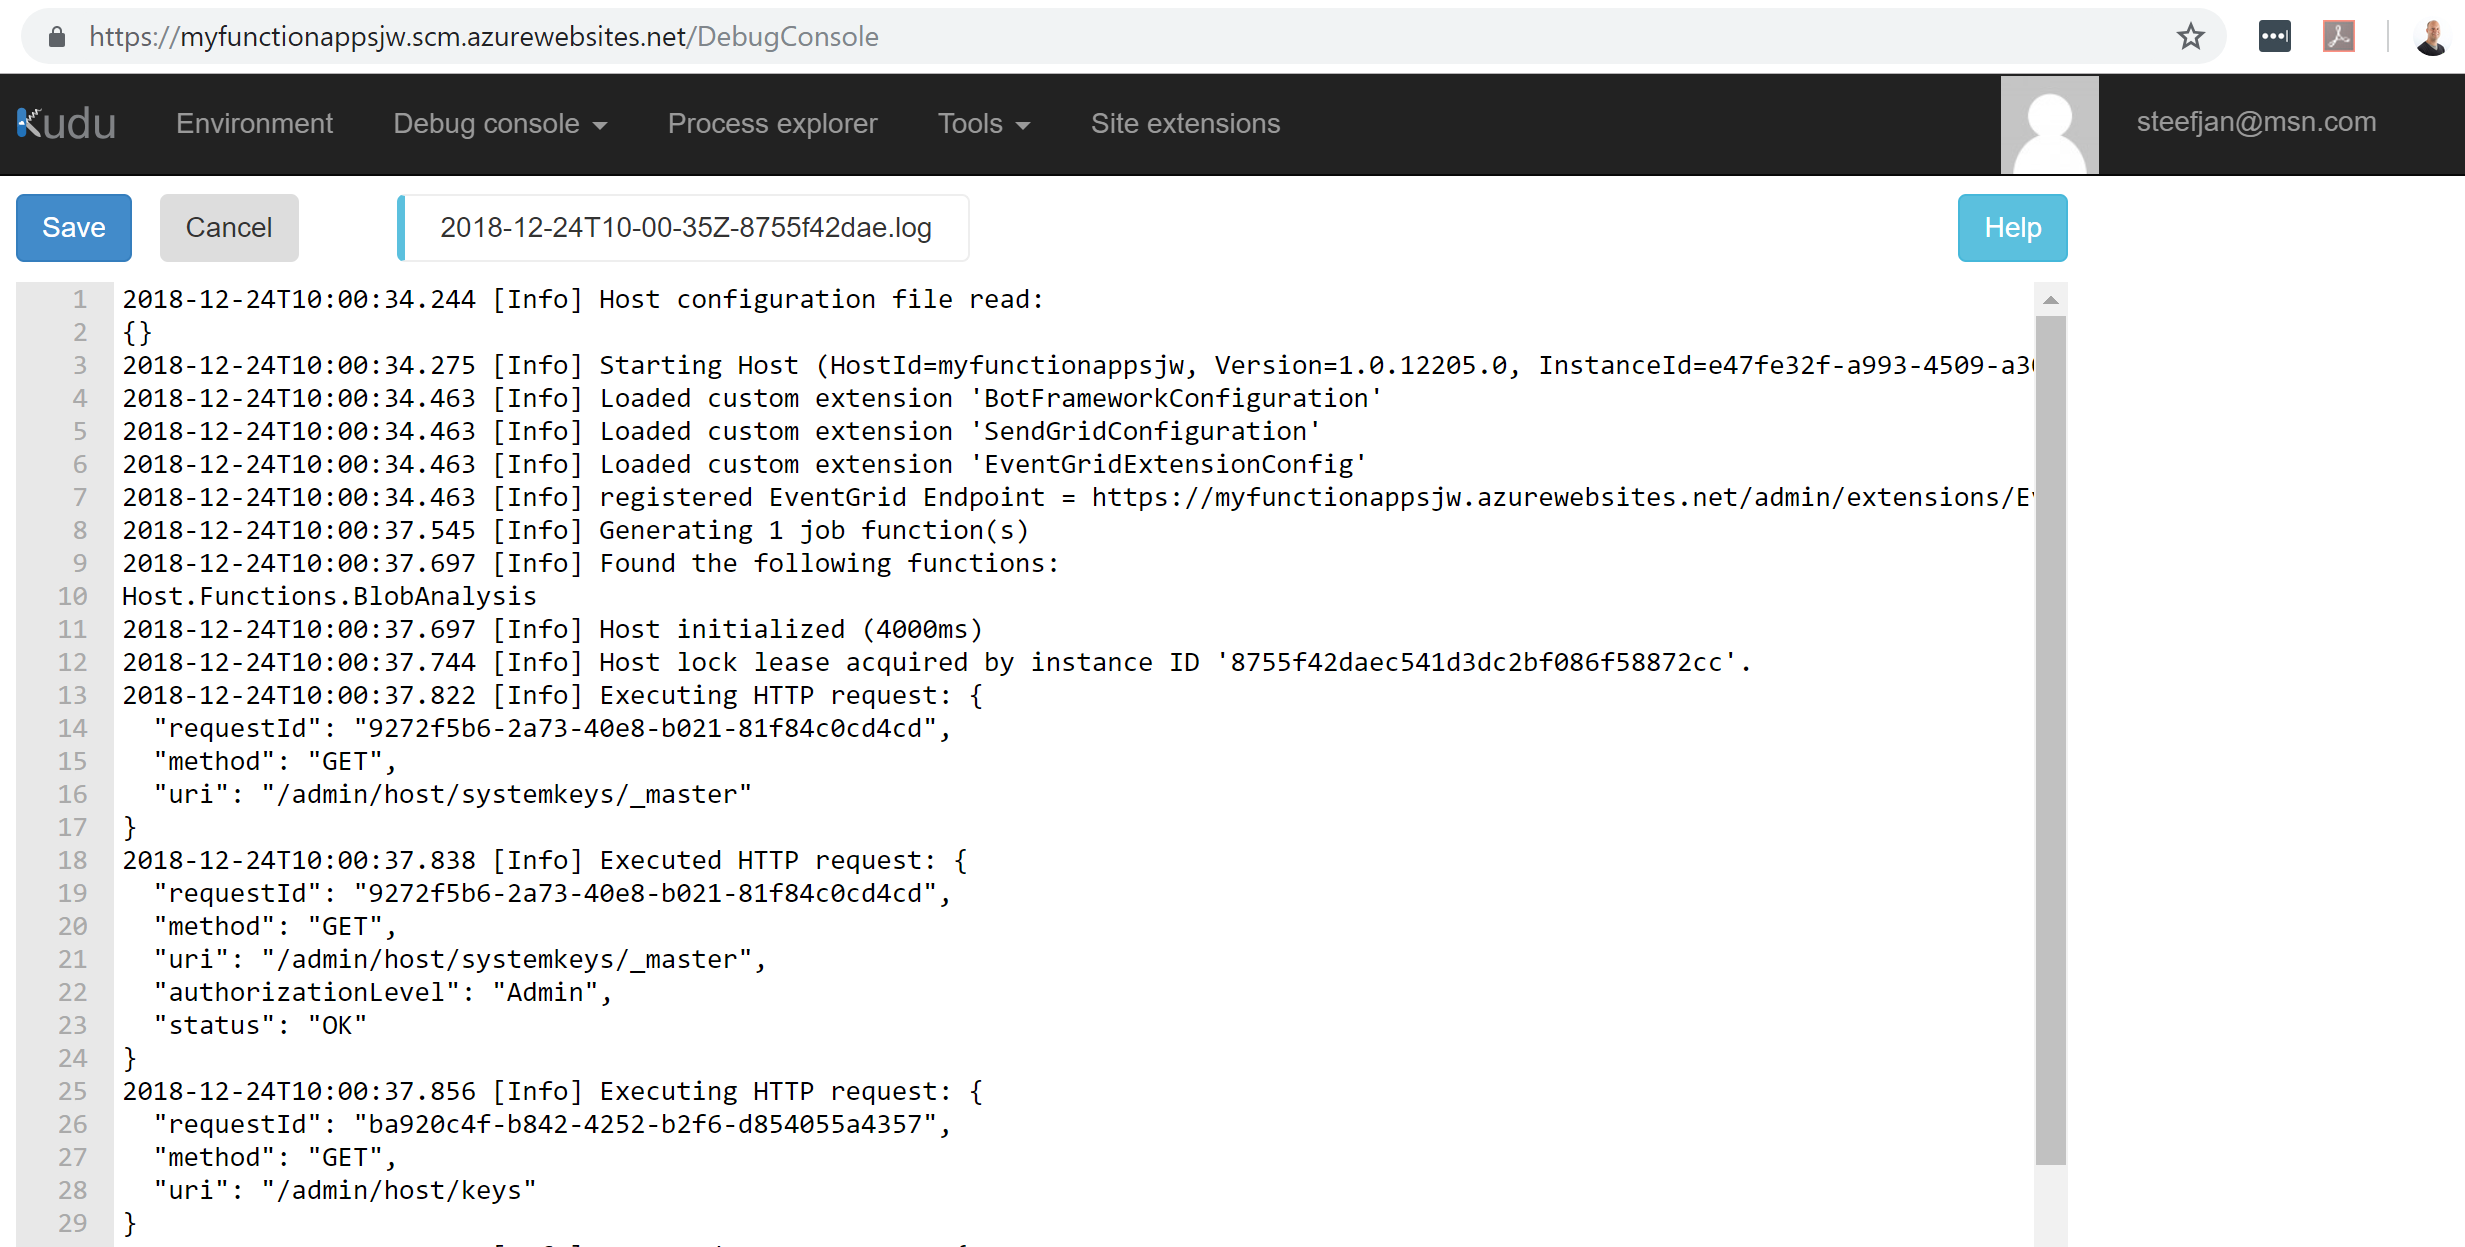
Once you are inside KUDU, you can drill into the log files of your function, and function host.
Furthermore, with KUDU you have the option to leverage the process explorer and enable profiling (only available if the Function Host is configured with an App Service Plan), create a diagnostic dump, and get an overview of the Function App environment including settings, system information, and variables.
KUDU is very useful for diagnostic and troubleshooting purposes when your function or function host fails - whereas Application Insights provides you with more in-depth insights into performance, behaviour, availability, and so on.
Both KUDU and Application Insights have a purpose, and the first is more suitable for operation professional and second more for developers and operations (DevOps).
Was this article helpful?