Gain Deeper Insights into Logic Apps Using Log Analytics
- Print
- DarkLight
- Download PDF
Gain Deeper Insights into Logic Apps Using Log Analytics
- Print
- DarkLight
- Download PDF
Article summary
Did you find this summary helpful?
Thank you for your feedback!
#ServerlessTips - Azure Logic Apps
Author: Kent Weare Integration MVP
Gain Deeper Insights into Azure Logic Apps using Azure Log Analytics
Within the Azure portal, Microsoft provides a lot of insights for Azure Logic Apps. However, these insights are generally contained within the management plane for a single logic app. Within this management plane we can manage Access Control, Workflow settings, API connections and Run history properties.
If we need to dive deep into the specific behavior of a single run, we have great visibility into the events that took place, including a graphical run details that will show us all of the inputs, outputs and action durations.
This out-of-box experience works well for managing individual logic apps, but how can we get a more holistic view of many, or all, of our logic apps? The answer is Azure Log Analytics.
Azure Log Analytics is a service provided by Microsoft that allows developers and administrators to send their application and infrastructure telemetry to a common location. Once data has been sent to Log Analytics, administrators can use out-of-box dashboards or write custom queries to gain insights into many, or all logic apps, within a subscription.
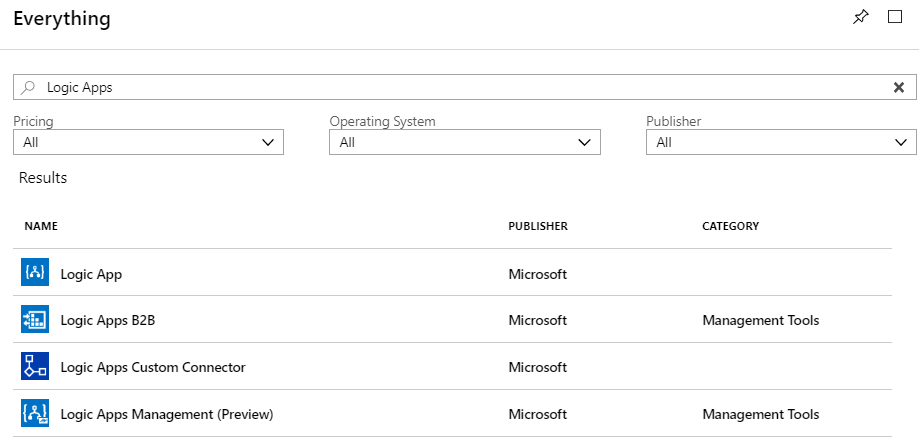
The Azure Logic Apps team has created a Log Analytics solution which can be provisioned by adding a new resource from the Azure Portal called Logic Apps Management (Preview).
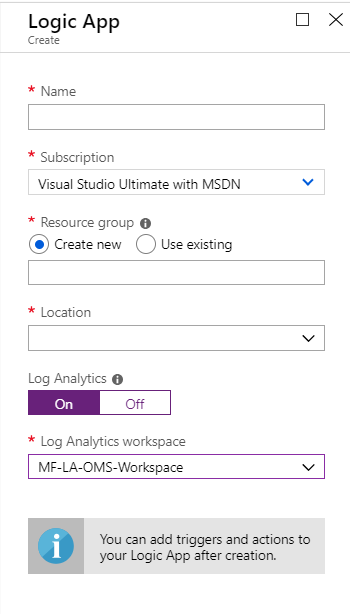
Once the management solution has been provisioned and a workspace has been created, a developer can opt-in to sending telemetry to Log Analytics when creating a new logic app.
To enable publishing logic app telemetry, enable Log Analytics and then select your workspace.
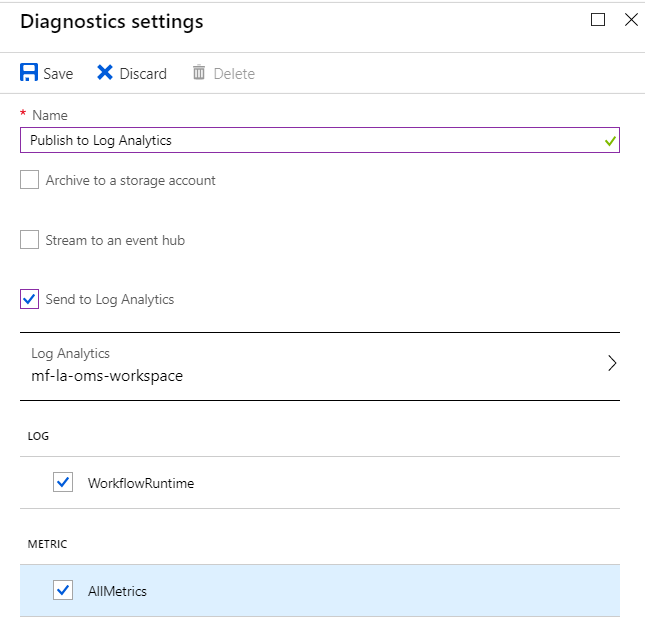
If you already have existing logic apps that you want to start publishing telemetry for, you can enable it from the Diagnostic settings menu for that logic app.
When our logic apps run, we will start to see telemetry appear in our Log Analytics Workspace. For example, we will be able to see a summary view of our logic apps for the previous 24 hours. In addition, we can also choose to pin this to our dashboard. To get deeper insight, we can go ahead and click on the visualization to enter an experience that has more details.
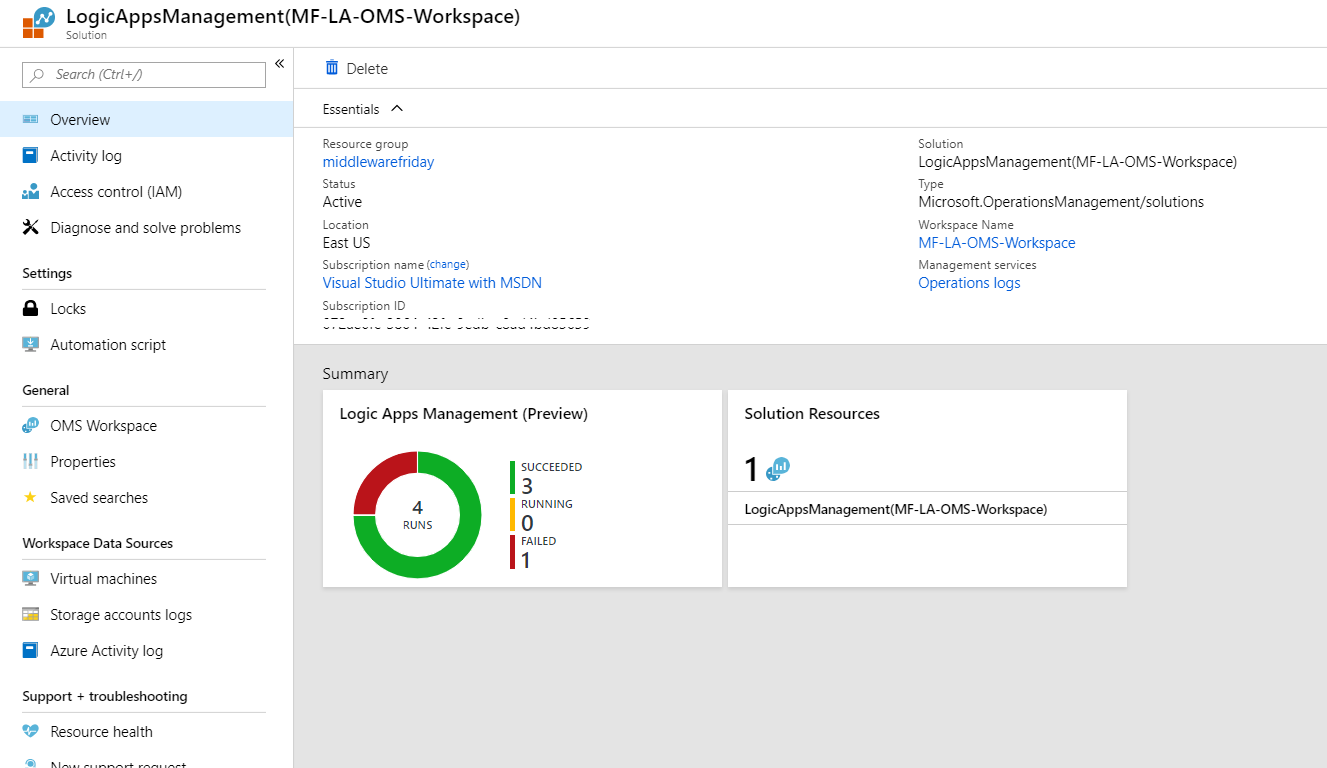
Within the detailed screen we can change our timeline filters, get insights into Logic App Runs by Status and Actions and Triggers by Error Code.
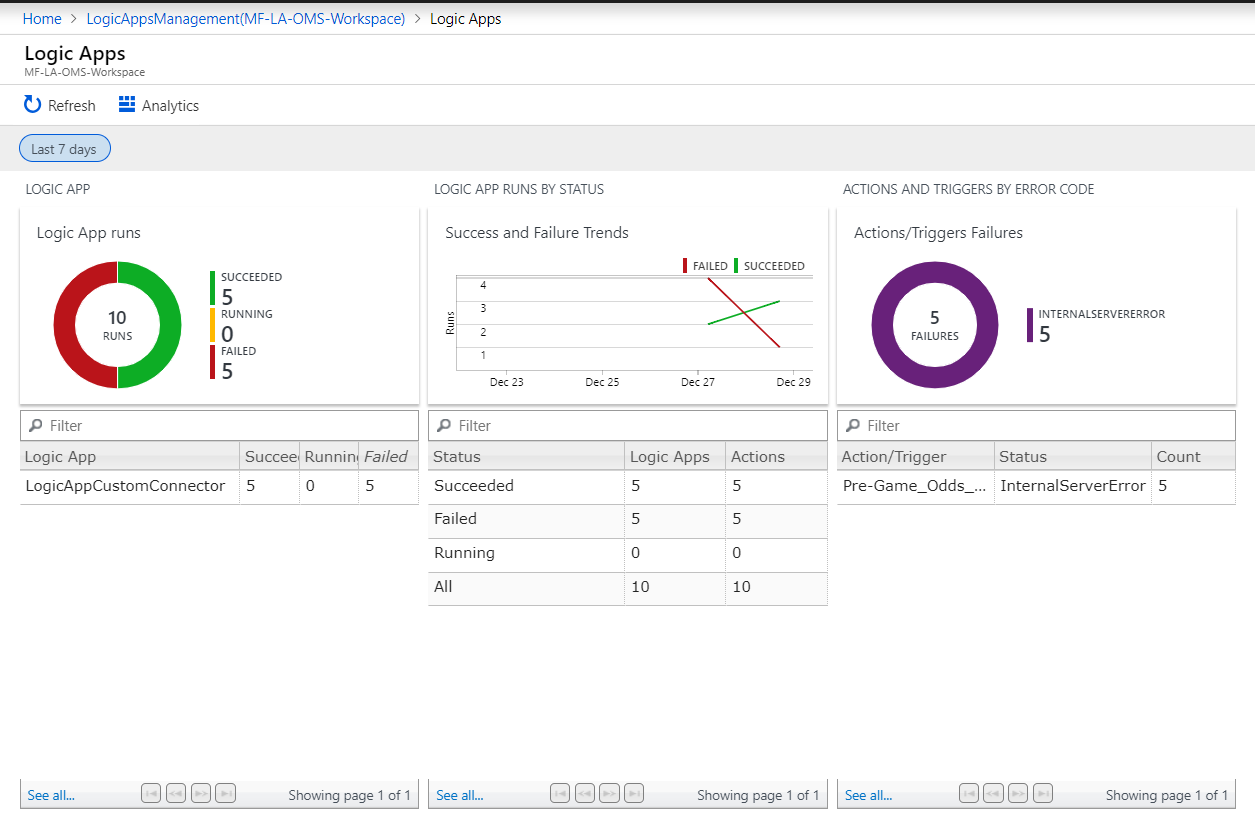
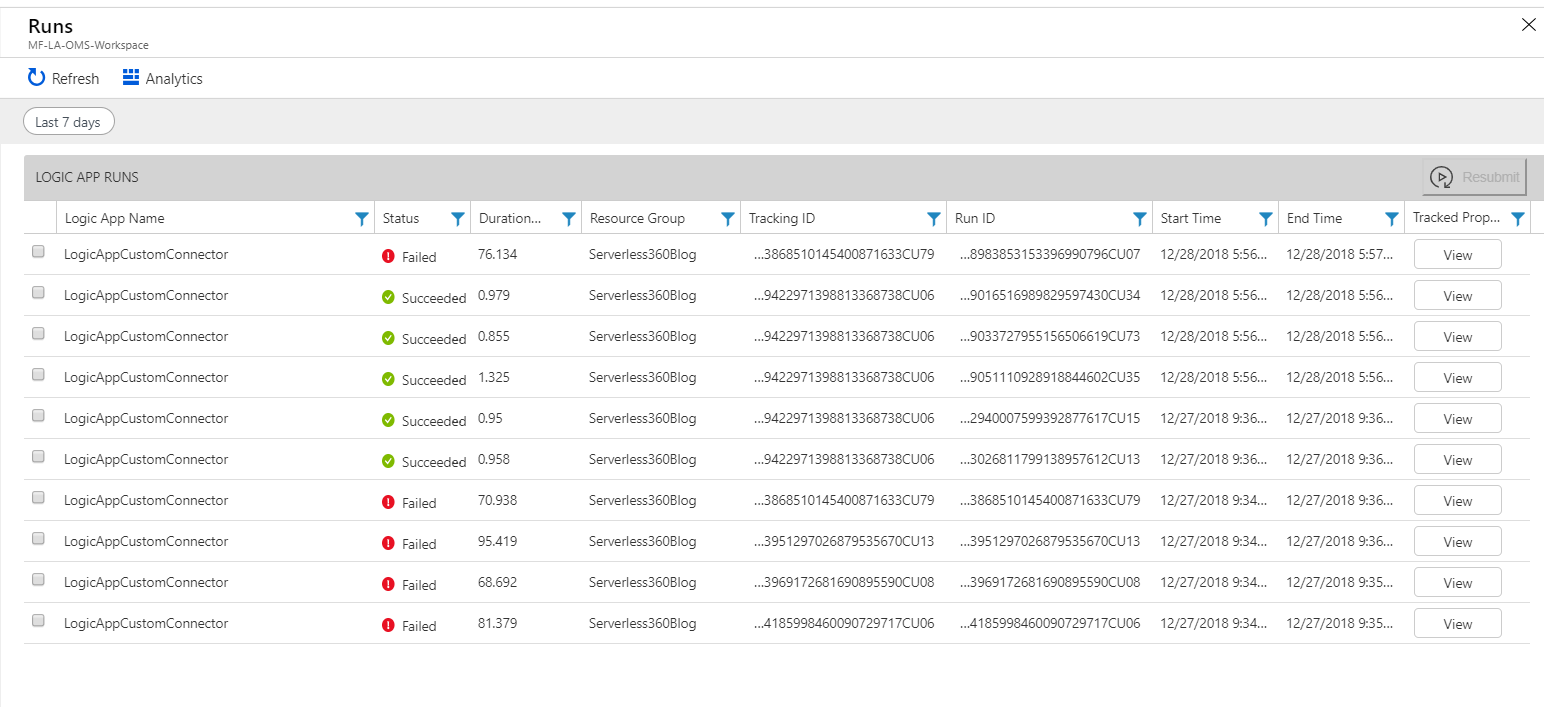
To see more details for a specific logic app, click on its name to see a table view that contains more detailed information about previous runs. From this view, we can filter based upon status or other attributes and also view any Tracked Properties.
In this post, we discussed how we can send diagnostic telemetry from new, or existing, logic apps to another Azure service called Log Analytics.
Using Log Analytics allows us to collect information from a variety of logic apps where this data can be viewed from a central location.
We also discussed some visualizations that can be used to quickly gain insights into the overall health of our interfaces. Beyond what was discussed in this post, custom queries can also be run against this data store for a customized experience.
Get a better understanding of Azure Logic Apps logging, monitoring and troubleshooting at multiple levels.
Was this article helpful?