- Print
- DarkLight
- PDF
Diagnostics with Azure Functions
- Print
- DarkLight
- PDF
Instrumenting code is critical to gain insights in what is going at runtime. With Azure Functions, you can also instrument them with ILogger. Furthermore, in the previous tips, we discussed integration with Application Insights and monitoring with Turbo360 (Formerly Serverless360).
You can also leverage Azure Monitor Logs to monitor your functions since they offer integration with them. With Azure MonitorLogs you centrally consolidate all the logs of your functions in a Function App. Furthermore, you can according to the Microsoft docs create and test queries using Log Analytics in the Azure portal and then either directly analyze the data using these tools or save queries for use with visualizations or alert rules.
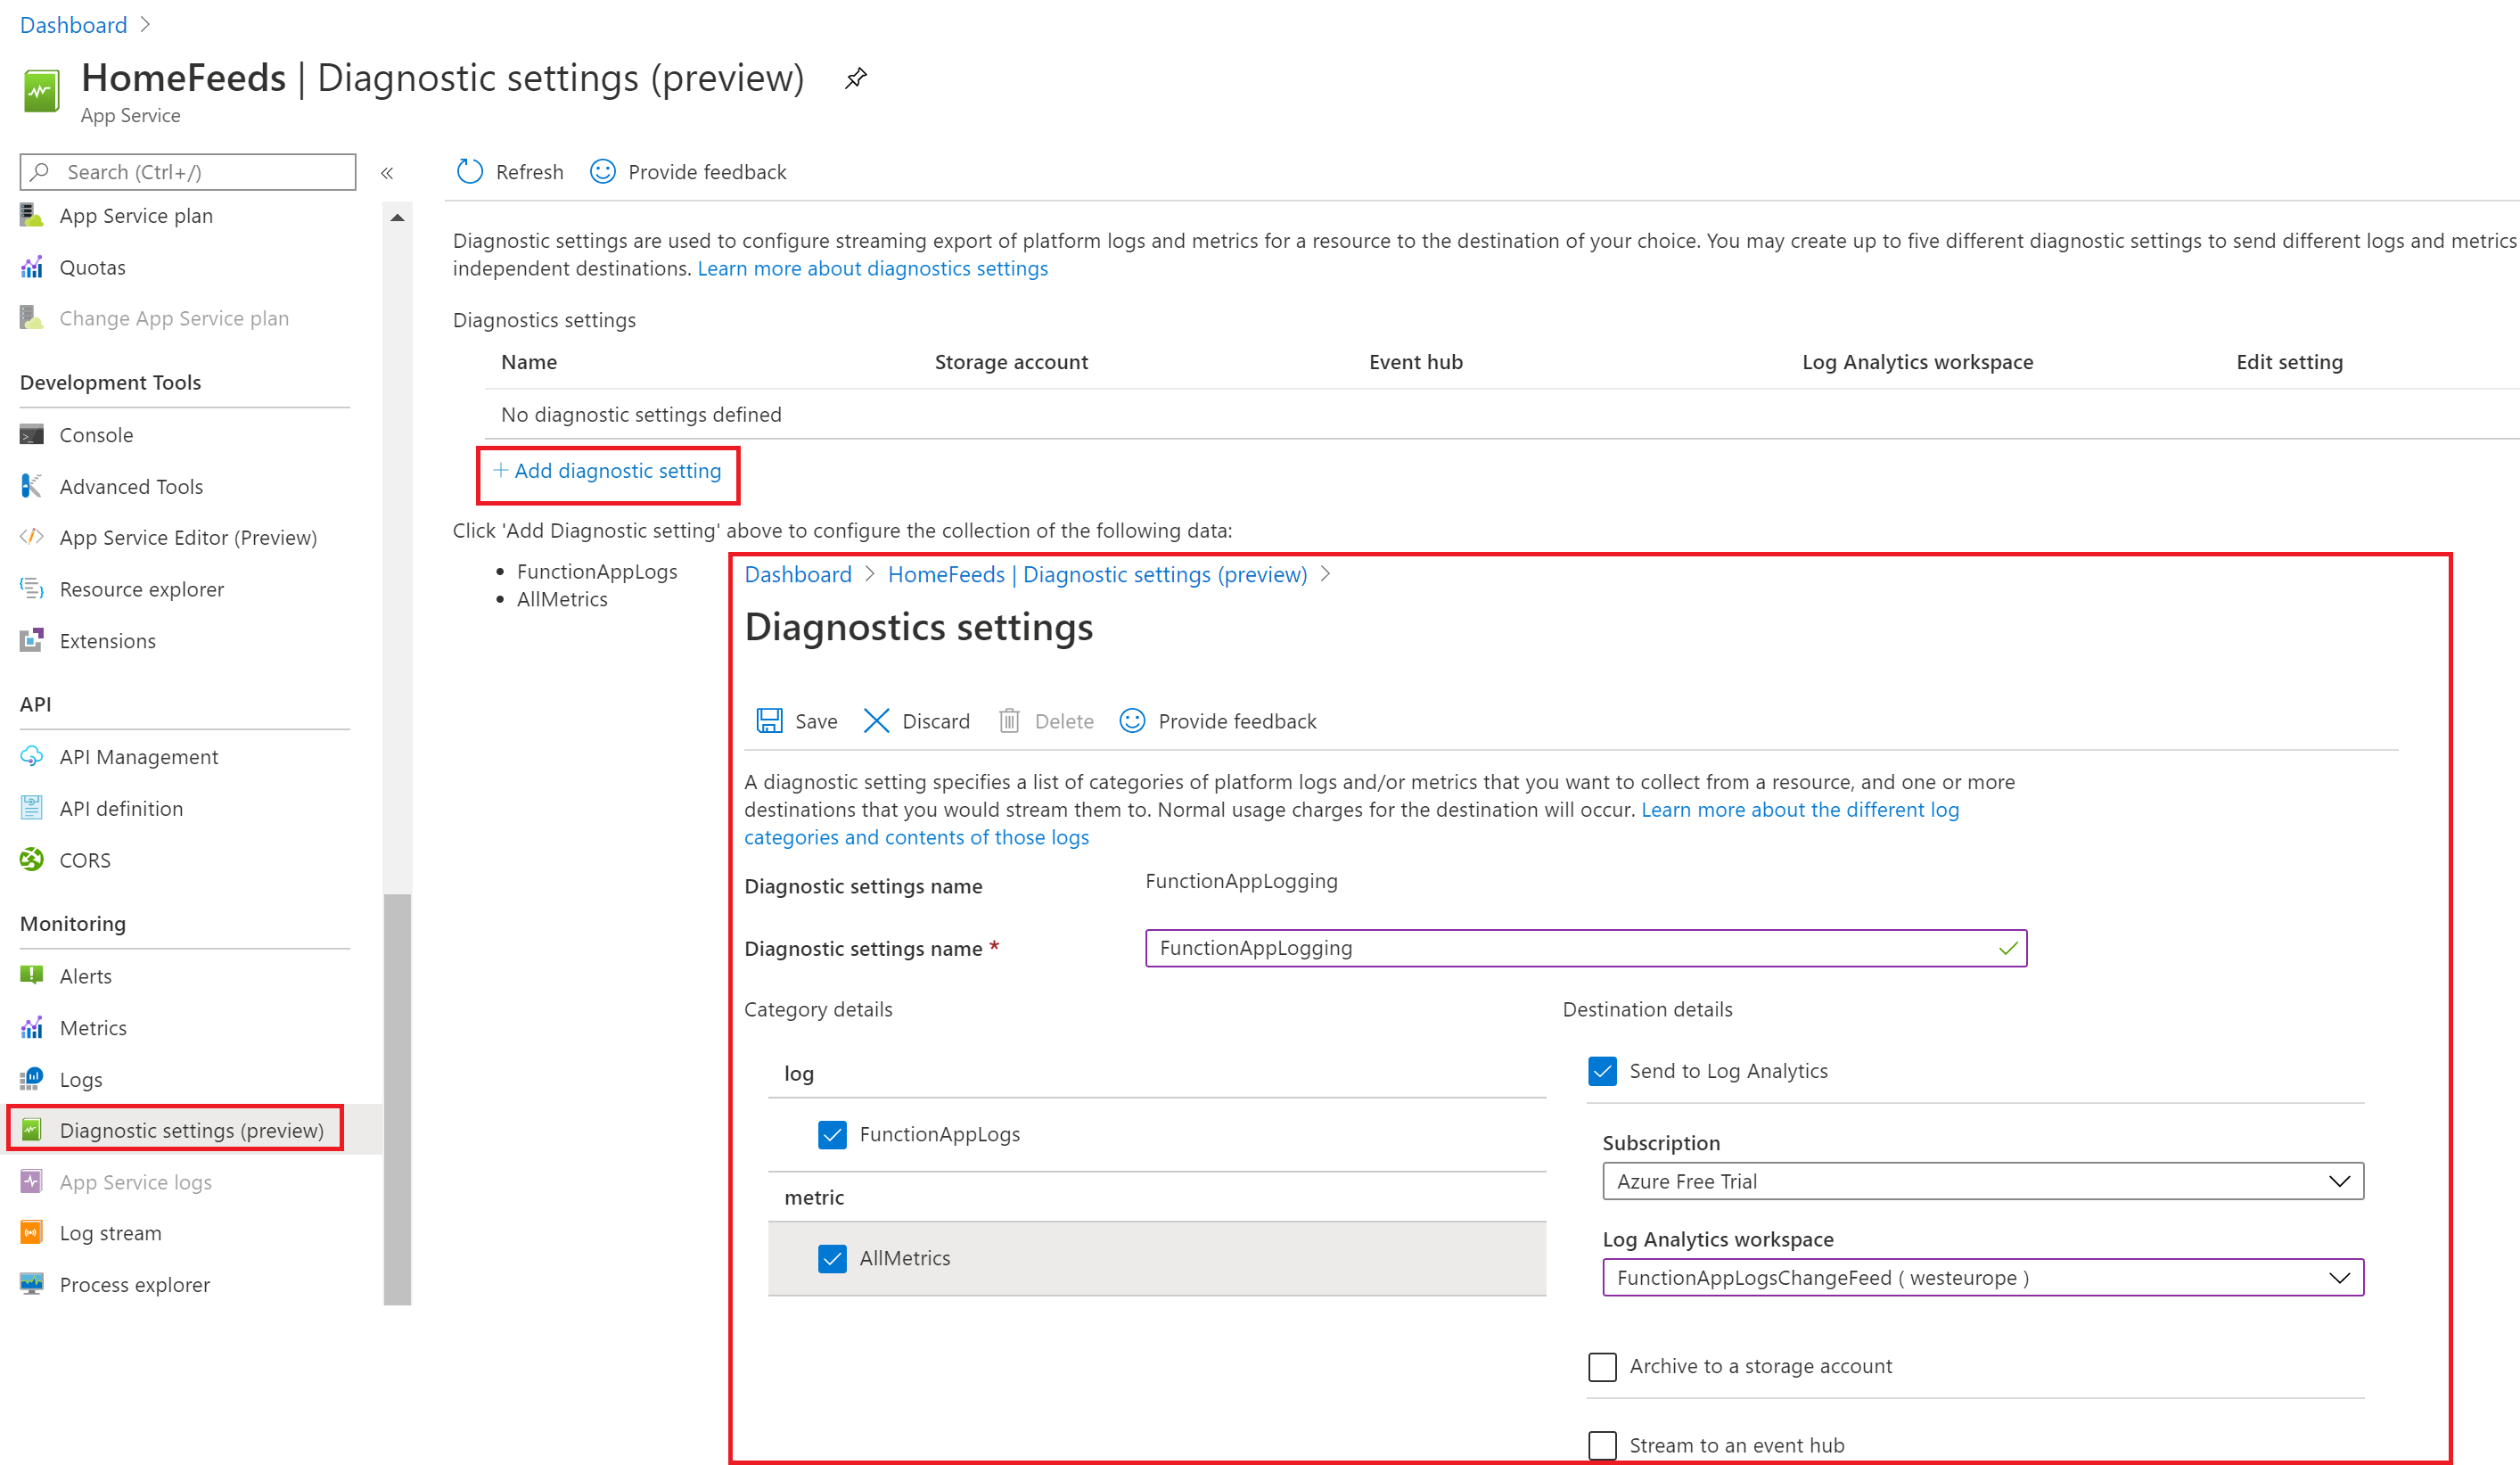
Setup of directing your log telemetry to Azure Monitor Logs is straight forward. You create a Log Analytics workspace first; subsequently, you go to your Function App, and choose Diagnostic Settings and configure the settings

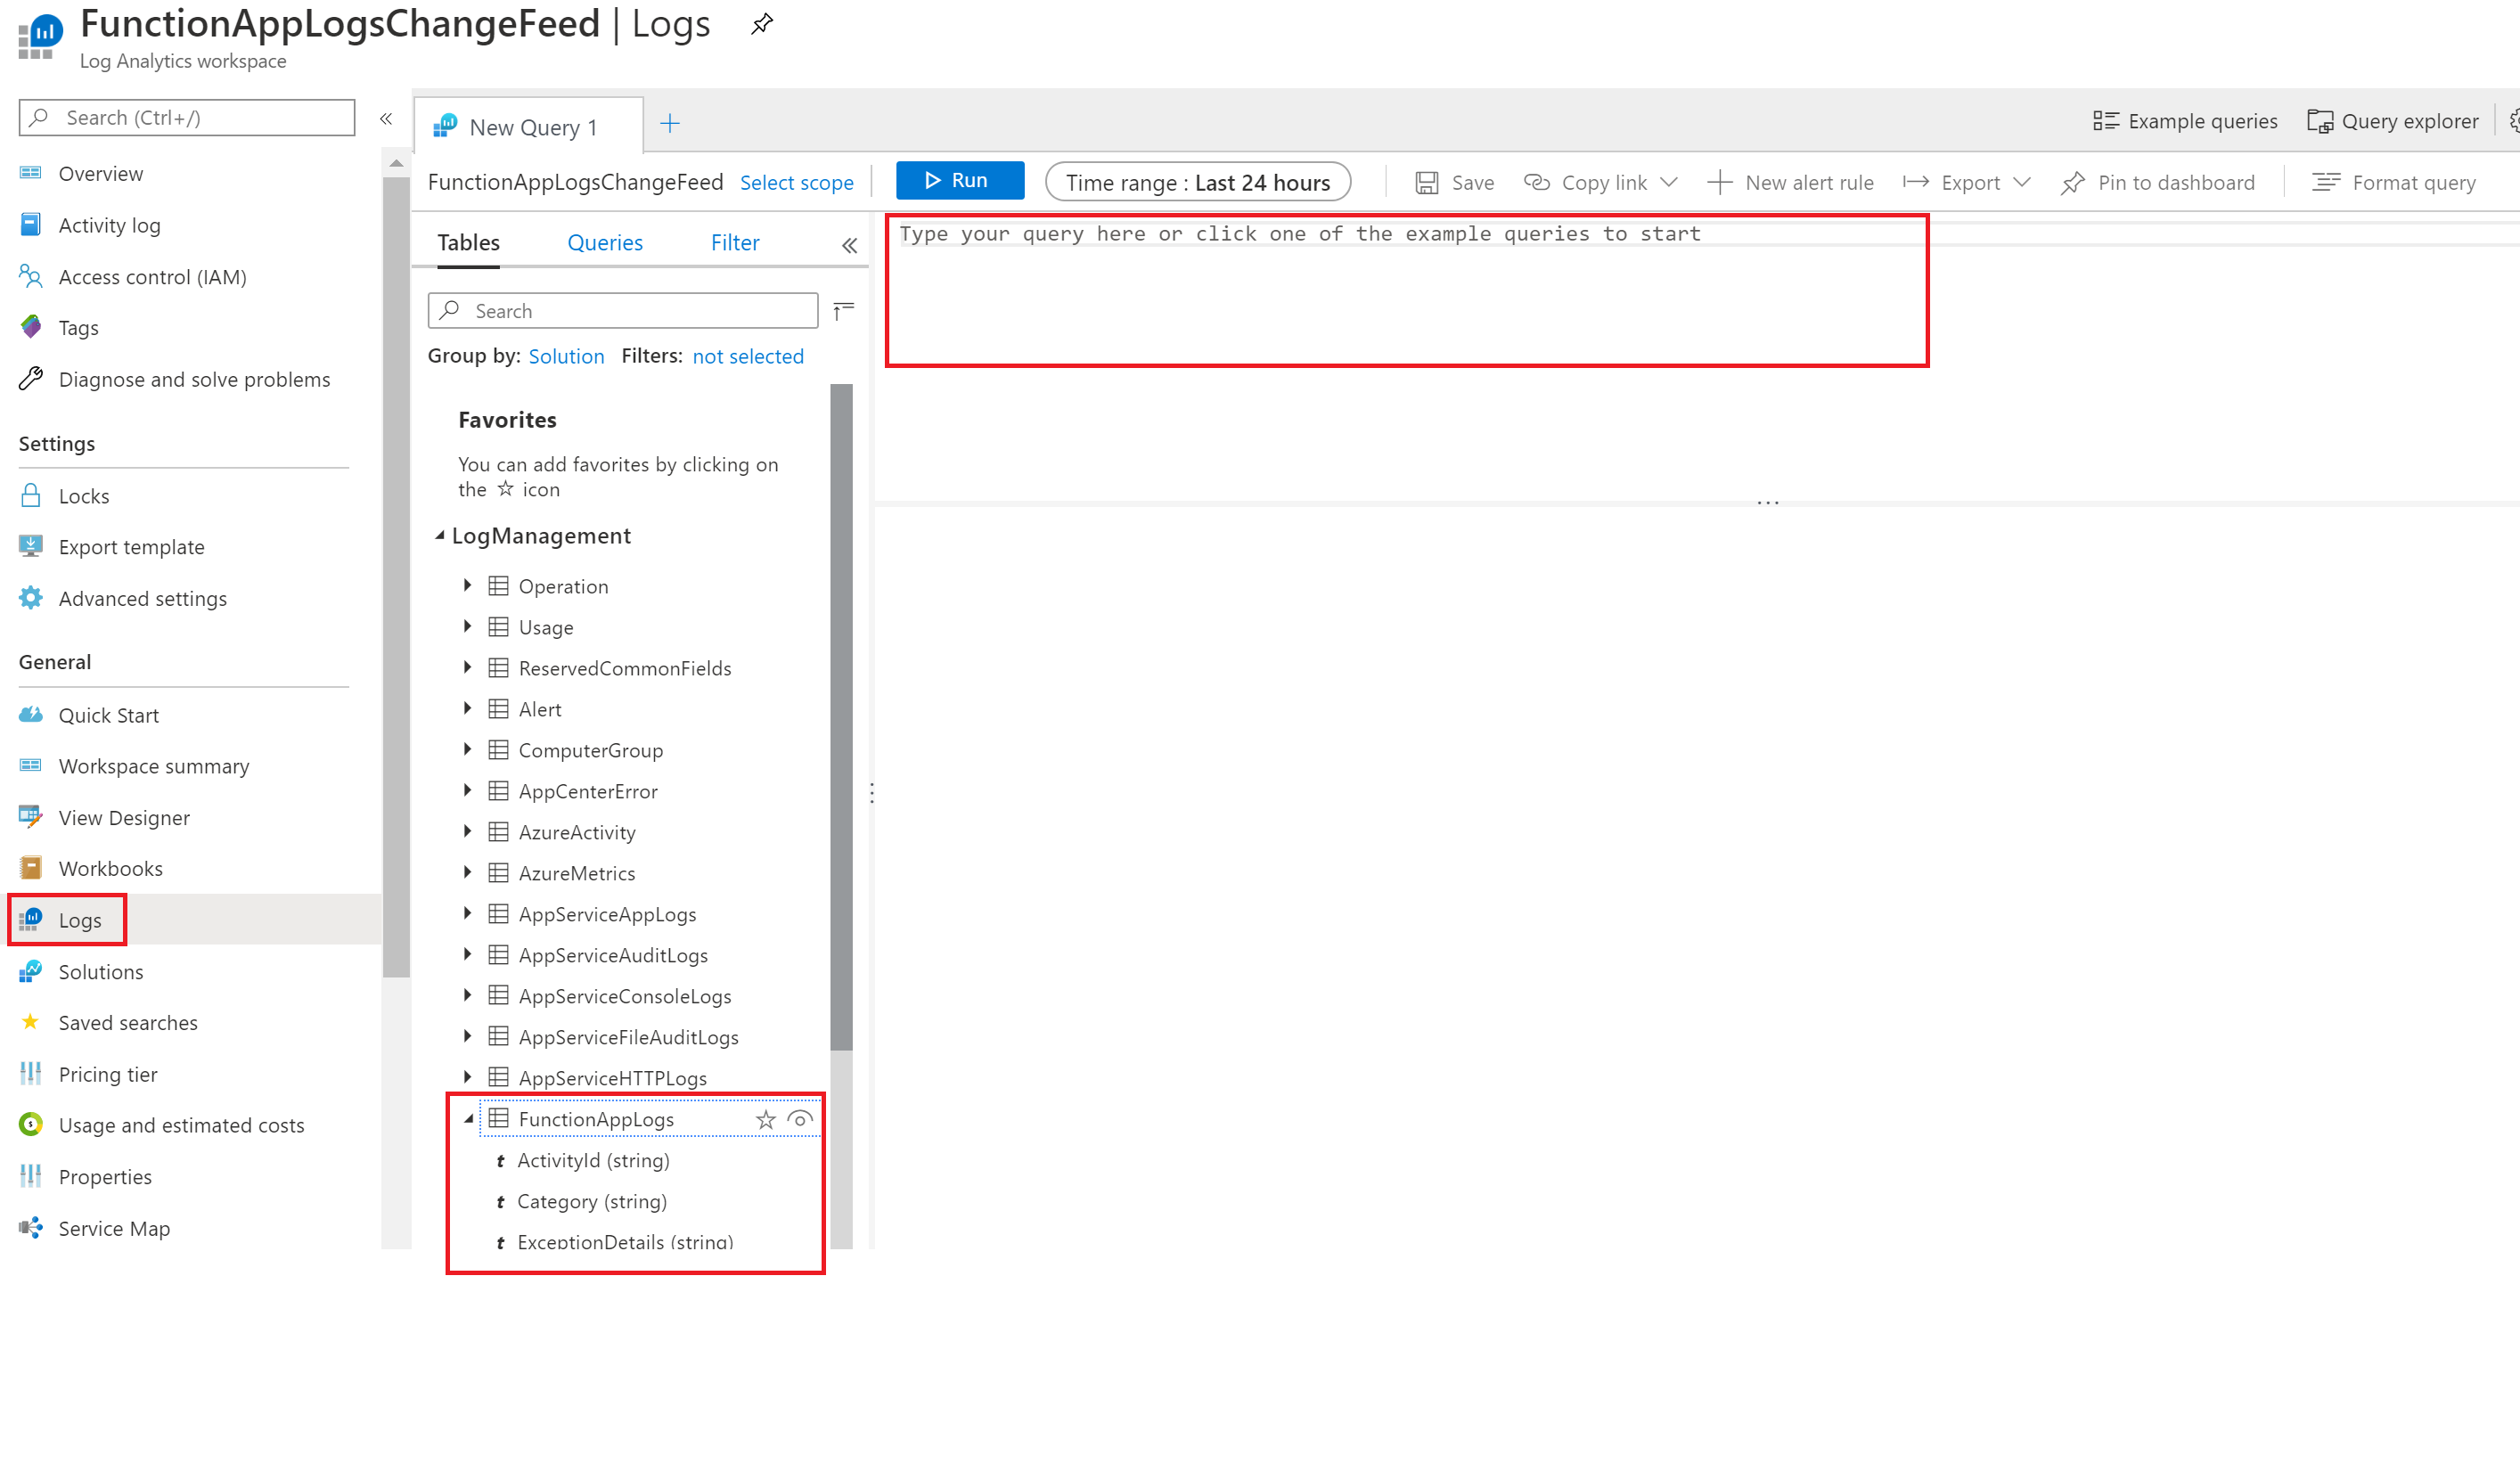
Once you have configured your diagnostic settings and send logs to the specified analytics workspace, you can access the log telemetry via Log Analytics Workspace under General. Next, you can start creating queries on the log data.

With diagnostics set, you can query and analyze your function log data. Moreover, you can gain insights into your Function (s) behaviour and troubleshoot easily. The query language for Log Analytics is Kusto, and its syntax is available, and examples are available on the Microsoft docs.

