How to Configure Log Analytics in Synapse?
- Print
- DarkLight
- PDF
How to Configure Log Analytics in Synapse?
- Print
- DarkLight
- PDF
Article summary
Did you find this summary helpful?
Thank you for your feedback!
#ServerlessTips - Azure Synapse
Author: Michael John Peña, Azure MVP
Azure Synapse Pipelines are a powerful way to orchestrate data integration and transformation workflows in Azure Synapse Analytics. They allow you to move data from various sources, perform complex transformations using data flows or notebooks, and load data into various destinations.
However, as with any data pipeline, you may encounter issues or errors that affect the performance, reliability, or accuracy of your pipelines. How can you monitor and troubleshoot your pipelines effectively?
In this blog post, we will show you how to use Azure Monitor and Log Analytics to gain insights into your pipeline runs, identify and diagnose issues, and resolve them quickly. We will cover the following topics:
- Enabling Azure Monitor and configuring diagnostic settings for your Synapse workspace.
- Steps to check pipeline run metrics and logs in the Azure portal.
- Writing and running log queries with Log Analytics.
- Creating alerts and dashboards by using log queries.
- Using Azure Monitor Application Insights for monitoring and resolving data flow issues.
Enabling Azure Monitor for your Synapse workspace
Azure Monitor is a comprehensive monitoring solution that collects, analyses, and acts on telemetry data from your cloud and on-premises environments. It helps you maximise the availability and performance of your applications and services and proactively identifies problems.
To use Azure Monitor for your Synapse pipelines, you need to enable it for your Synapse workspace. This will allow Azure Monitor to collect metrics and logs from your pipelines and store them in a Log Analytics workspace. A Log Analytics workspace is a central repository for log data from various sources in Azure.
To enable Azure Monitor for your Synapse workspace, follow these steps:
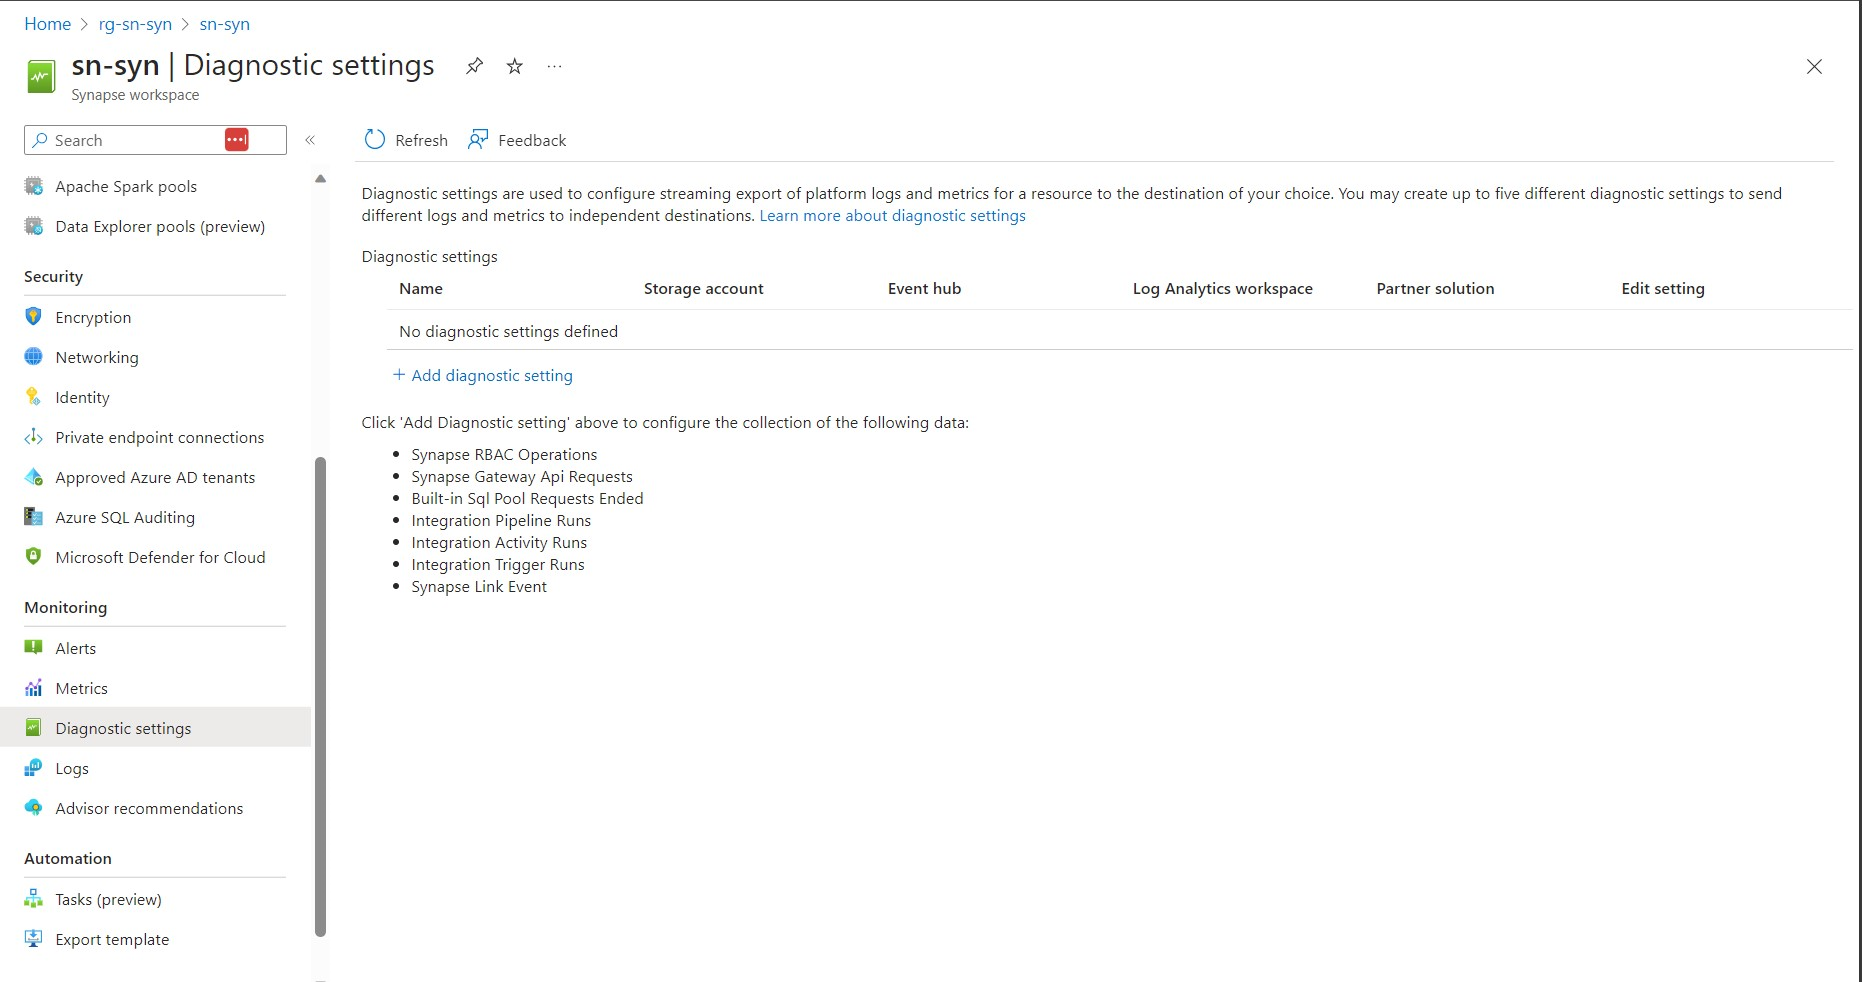
- In the Azure portal, go to your Synapse workspace resource.
- In the left pane, under monitoring, select diagnostic settings.
- Select Add diagnostic setting.
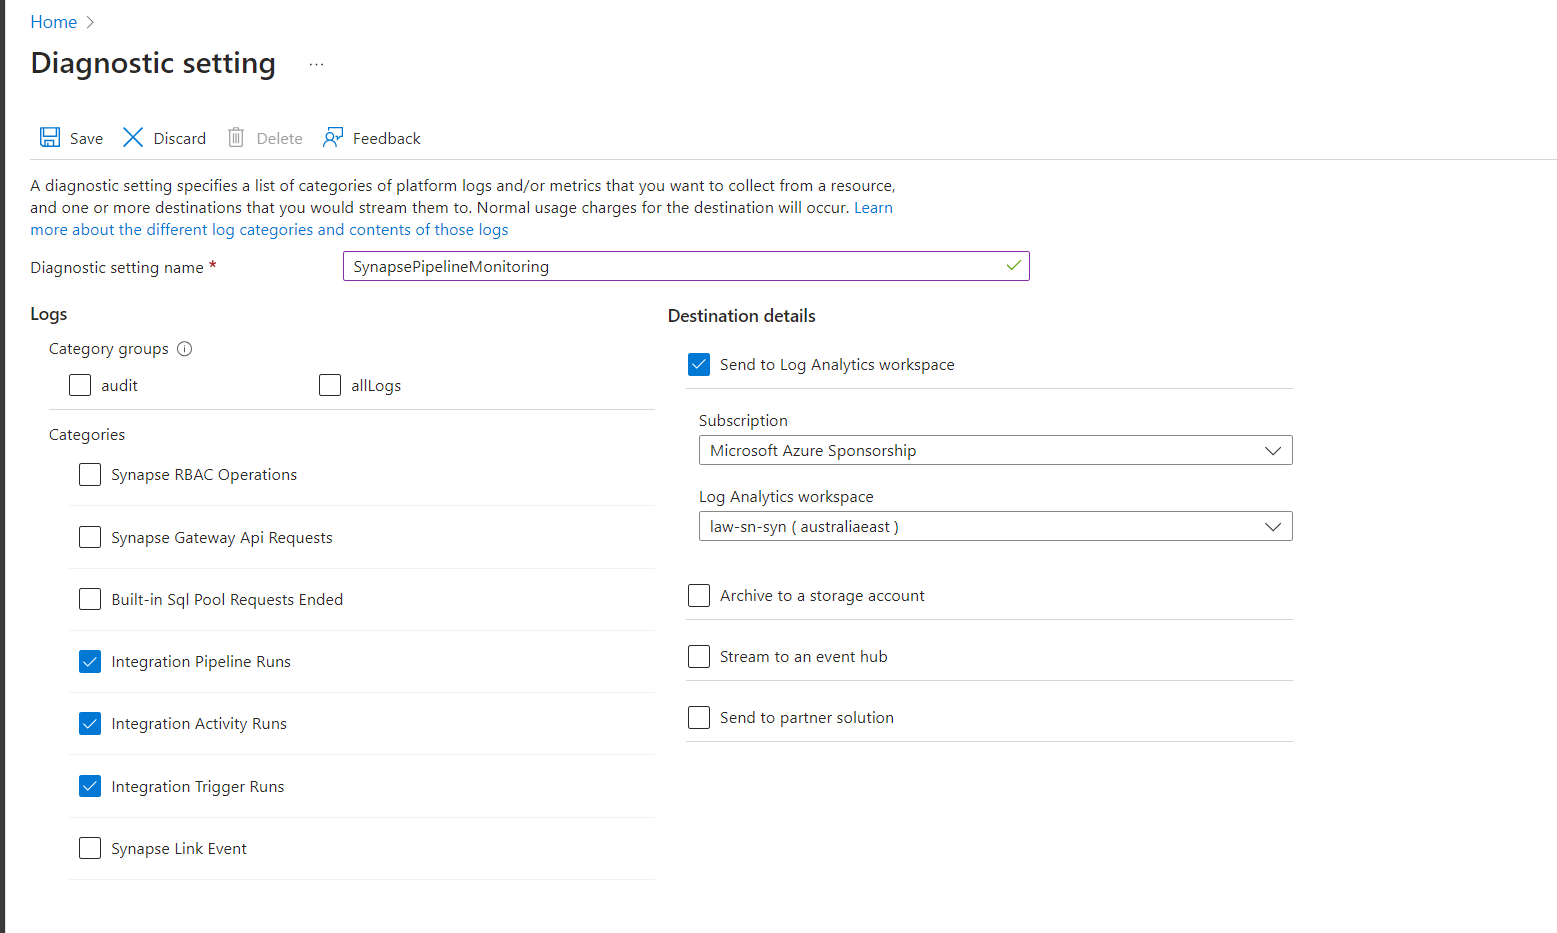
- Give a name for your diagnostic setting, such as "SynapsePipelineMonitoring”.
- Under Log, select the categories of logs that you want to collect from your pipelines. For example, you can choose from the following categories.
a)Integration Pipeline Runs: Contains information about pipeline runs, such as start time, end time, status, duration, error details, etc.
b)Integration Activity Runs: Contains information about activity runs within a pipeline run, such as start time, end time, status, duration, error details, etc.
c)Integration Trigger Runs: Contains information about trigger runs that start pipeline runs, such as start time, end time, status, trigger type, etc. - Under Destination details, select Send to Log Analytics workspace.
- Select a Log Analytics workspace where you want to store the log data. You can choose an existing workspace or create a new one.
- Select Save.
After you enable Azure Monitor for your Synapse workspace, it may take some time for the log data to appear in the Log Analytics workspace. You can check the status of your diagnostic setting in the Azure portal.

Was this article helpful?