- Print
- DarkLight
- PDF
Tracking Message Properties
- Print
- DarkLight
- PDF
Building integrated solutions can be challenging from many perspectives, including understanding the various systems you connect to, data transformations, performance, monitoring, alerting and tracking. When it comes to tracking, Azure Logic Apps has some additional capabilities beyond the out-of-box capabilities. These additional capabilities are unlocked by enabling diagnostics for a logic app and publishing the data to Log Analytics.
With a Log Analytics workspace configured, and diagnostics configured within our logic app, we will see diagnostic events emitted to Log Analytics.
If we click into a specific run, by clicking on a row, we will see granular information related to the action or trigger. Similarly, we can click on a row and dive deeper into the specifics of that action or trigger. The information provided out-of-box is helpful, but it is all system generated.

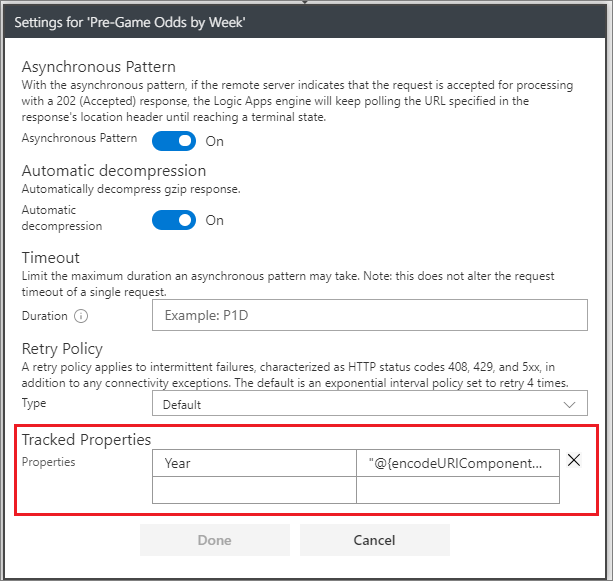
Consider we have a logic app that has an HTTP request endpoint. As part of this configuration, we have two relative path parameters: year/{yearID}/week/{weekID}. Within our logic app, we want to track these properties when they are provided to a custom connector. There are two ways to track these properties:
Designer experience
From the Settings option within each action, there is a Tracked Properties setting where static or dynamic values can be included based upon Logic Apps Workflow Definition Language.

Code view experience
Alternatively, we can update the code-behind for a specific action and embed a static or dynamic value.

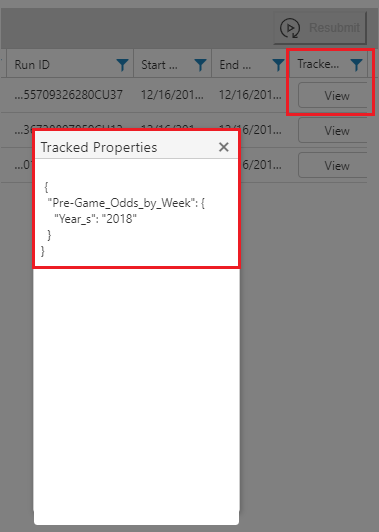
With our Tracked Properties configured, the next time we run our logic app, we will find our custom diagnostics included in our Log Analytics data.

Logic Apps provides a rich experience for tracking diagnostic information. This information includes both out of the box and custom data to ensure we have the right level of information to support our tracking needs.
Get a better understanding of Azure Logic Apps monitoring at multiple levels.


