Metrics monitoring and building dashboards for Synapse pipeline
- Print
- DarkLight
- Download PDF
Metrics monitoring and building dashboards for Synapse pipeline
- Print
- DarkLight
- Download PDF
Article summary
Did you find this summary helpful?
Thank you for your feedback!
#ServerlessTips - Azure Synapse
Author: Michael John Peña, Azure MVP
One benefit of using Log Analytics is that you can use your log queries to create alerts and dashboards based on your monitoring needs. You can create alerts based on specific conditions in your data, such as when a pipeline run fails or when a performance metric exceeds a threshold. Dashboards visualize your data in various charts and graphs that help you understand and analyse your data.
To create an alert based on a log query, follow these steps:
- In Log Analytics, write and run a log query that returns records that match your alert condition. For example, you can use the following query to return pipeline runs that failed in the last 15 minutes.
SynapseIntegrationPipelineRuns

| where Status == “Failed”

| where TimeGenerated > ago(15m)
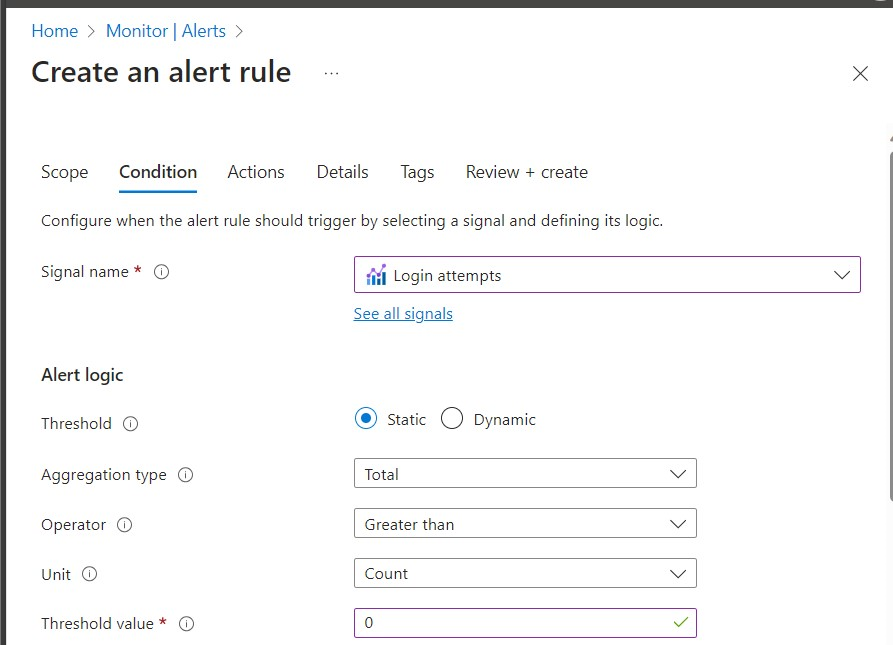
- Select New alert rule from the top menu.
- In the Create rule page, under Condition details, specify a name for your alert rule condition.
- In the Create rule page, under Condition details, specify a name for your alert rule condition, such as “Pipeline Run Failure Alert”. You can also modify the alert logic, such as changing the time period, the frequency, or the threshold for triggering the alert.
- Select Done to save your alert rule condition.
- In the Create rule page, under Action group details, select an existing action group or create a new one. On the Create rule page, go to the Action group details section and choose either an existing action group or create a new one. This will help you define the actions to be taken when the alert goes off. The actions may include emailing, calling a webhook, or running a logic app.
- Select Done to save your action group.
- In the Create rule page, under Alert rule details, specify a name for your alert rule, such as “Pipeline Run Failure Alert Rule”. You can also change the alert severity, enable or disable the alert rule, and add tags or notes to your alert rule.
- Select Create alert rule to create your alert rule.
To create a dashboard based on a log query, follow these steps:
- In Log Analytics, write and run a log query that returns records you want to visualize in a dashboard. For example, you can use the following query to return the average duration of pipeline runs by pipeline name in the last 24 hours:
PipelineRuns

| where TimeGenerated > ago(24h)

| summarize avg(Duration) by PipelineName
- Select Pin to dashboard from the top menu.
- In the Pin to dashboard page, select an existing dashboard or create a new one. You can also change the title and subtitle of your chart.
- Select Apply to pin your chart on the dashboard.
You can view your dashboards in the Azure portal by selecting Dashboards from the left pane. You can also edit, share, or delete your dashboards as needed.

Was this article helpful?