Query Synapse pipeline run history in Log Analytics
- Print
- DarkLight
- Download PDF
Query Synapse pipeline run history in Log Analytics
- Print
- DarkLight
- Download PDF
Article summary
Did you find this summary helpful?
Thank you for your feedback!
#ServerlessTips - Azure Synapse
Author: Michael John Peña, Azure MVP
Viewing pipeline run metrics and logs in the Azure portal
Once you have enabled Azure Monitor for your Synapse workspace, you can view some basic metrics and logs for your pipeline runs in the Azure portal. This can help you get a quick overview of the health and performance of your pipelines.
To view pipeline run metrics in the Azure portal, follow these steps:
- In the Azure portal, go to your Synapse workspace resource.
- In the left pane, under monitoring, select Metrics.
- In the Metrics page, select Pipeline Runs as the metric namespace.
- Select one or more metrics that you want to view from the list of metrics. You can choose from the following metrics.
- Data Processed (Bytes)
- Login attempts
- Requests ended
- Activity Runs ended
- Optionally, you can apply filters to narrow down the scope of the metrics by pipeline name, trigger name, status, etc.
- Optionally, you can change the aggregation type (such as average, minimum, maximum) and the time range for the metrics.
- Optionally, you can pin the metrics chart to a dashboard or share it with others.

To view pipeline run logs in the Azure portal, follow these steps:
- In the Azure portal, go to your Synapse workspace resource.
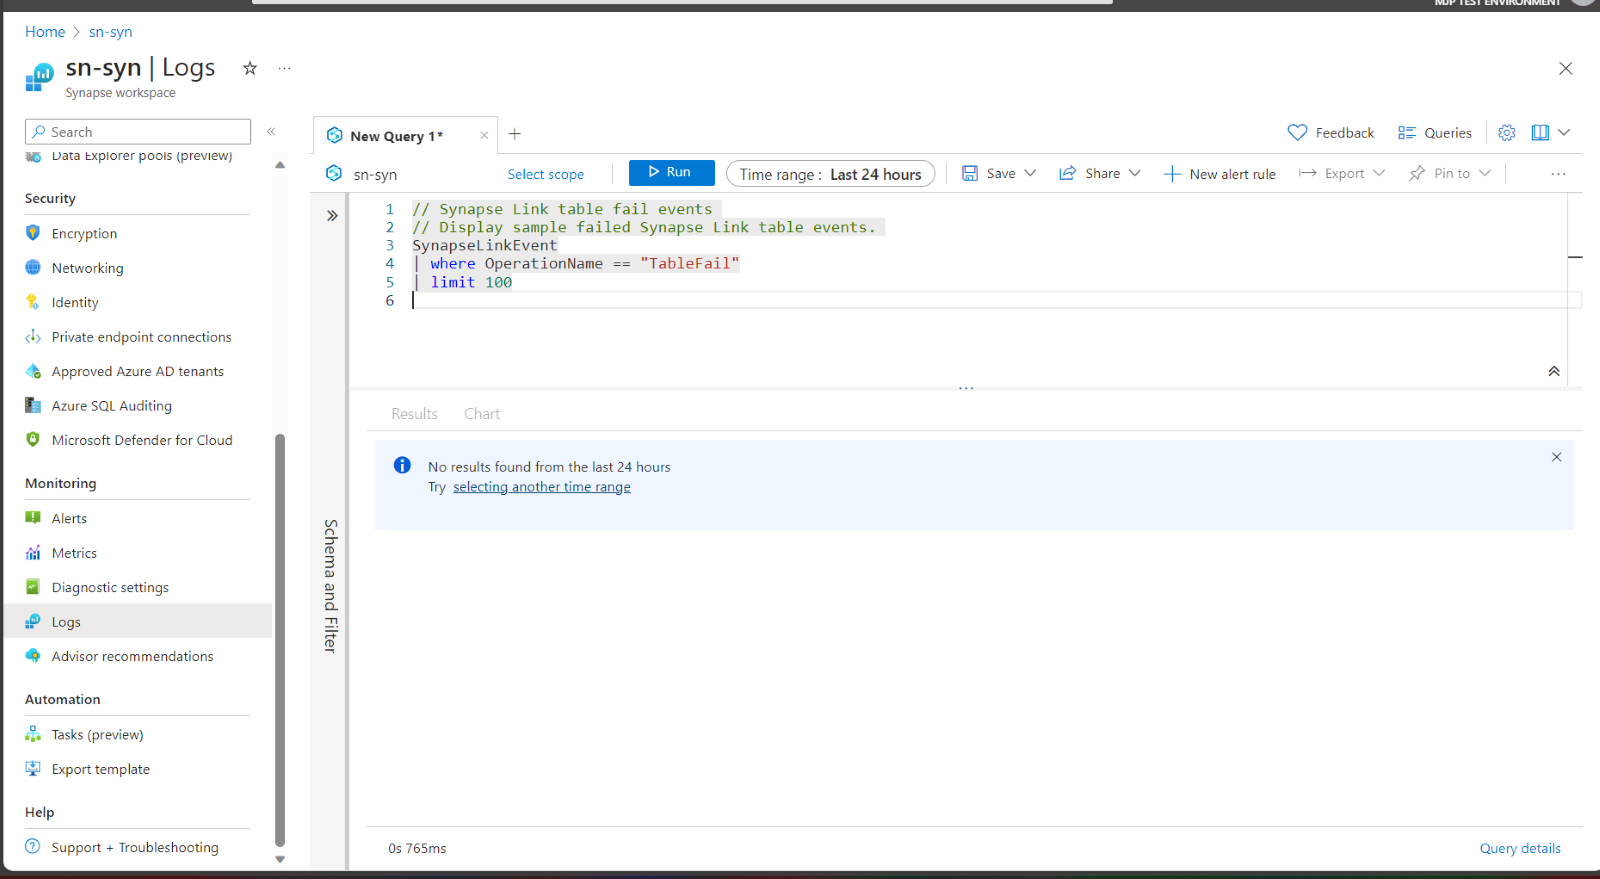
- In the left pane, under Monitoring, select Logs.
- On the Logs page, select SynapseLinkEvent as the log category.
- You will see a list of pipeline runs with their details, such as pipeline name, run ID, status, start time, end time, duration, etc.
- You can sort, filter, and search the list by any column or value.
- You can select a pipeline run to view more details, such as the activities within the pipeline run, the input and output parameters, the error details, etc.
- You can also select View in Log Analytics to open the Log Analytics tool and run log queries against the pipeline run data.
Writing and running log queries using Log Analytics
Log Analytics is a tool in the Azure portal that allows you to edit and run log queries against data collected by Azure Monitor logs and interactively analyze their results. You can use Log Analytics queries to retrieve records that match particular criteria, identify trends, analyze patterns, and provide various insights into your data.
Log Analytics uses a query language called Kusto Query Language (KQL), which is a powerful and expressive language that supports various operators, functions, and data types. You can learn more about KQL in the Kusto Query Language tutorial.
To write and run log queries using Log Analytics, follow these steps:
- In the Azure portal, go to your Synapse workspace resource.
- In the left pane, under Monitoring, select Logs.
- On the Logs page, select Log Analytics from the top menu.
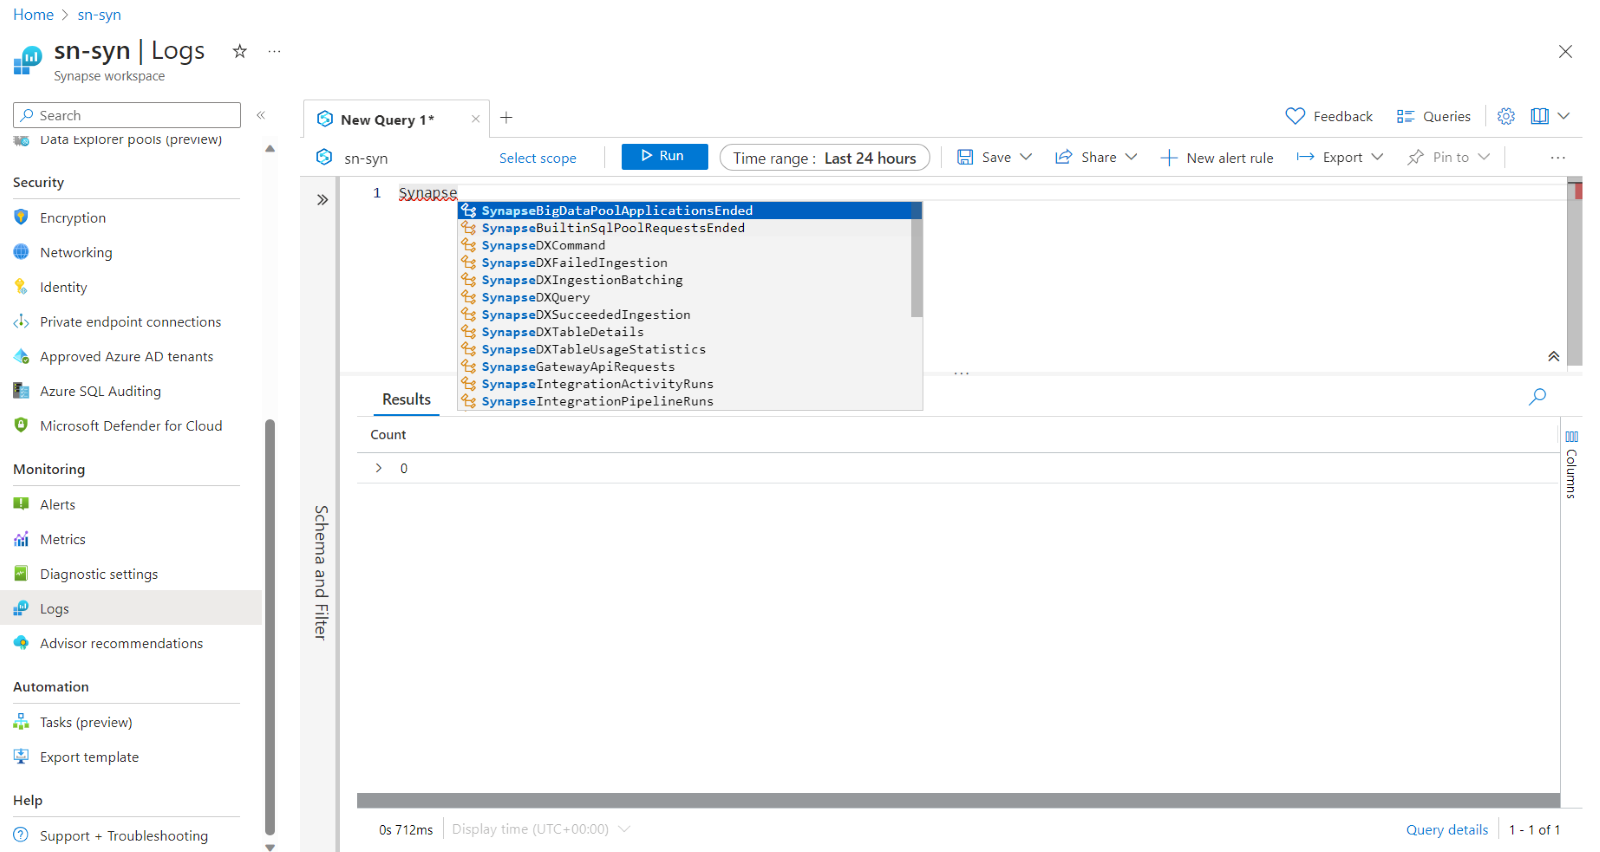
- You will see the Log Analytics tool with a query window and a results window.
- In the query window, you can write your log query using KQL syntax. You can also use the Tables tab on the left side to browse and select the tables and columns that you want to query.
- To run your query, select Run or press Shift + Enter. You will see the results of your query in the results window below.
- You can change your query or change the time range for your query as needed.
Here is an example of a log query that retrieves some information about pipeline runs that failed in the last 24 hours:
SynapseIntegrationPipelineRuns

| where Status == “Failed”

| where TimeGenerated > ago(24h)

| project PipelineName, RunId, TriggerName, TriggerType, ErrorMessage

| order by TimeGenerated desc
The query uses the following KQL elements:
- SynapseIntegrationPipelineRuns
- : - The name of the table that contains pipeline run data.
- | - The pipe operator that passes the output of one command to another command.
- where - The filter operator that filters records based on a condition.
- Status - The name of the column that contains the status of pipeline runs.
- ==: - The equality operator that compares two values for equality.
- "Failed" - The string literal that represents the value of failed status.
- TimeGenerated - The name of the column that contains the timestamp of pipeline runs.
- >: - The greater than operator that compares two values for order.
- ago(24h) - The function that returns a datetime value that is 24 hours before the current time.
- project - The projection operator that selects specific columns from a table.
- PipelineName, RunId, TriggerName, TriggerType, ErrorMessage - The names of the columns that contain information about pipeline runs.
- order by - The sorting operator that sorts records based on a column value.
- desc - The keyword that specifies descending order.
The result is a table with five columns and one or more rows, depending on how many pipeline runs failed in the last 24 hours. Note that the Project values must exist in the workspace.

Was this article helpful?