Service Bus Diagnostics Logs
- Print
- DarkLight
- Download PDF
Service Bus Diagnostics Logs
- Print
- DarkLight
- Download PDF
Article summary
Did you find this summary helpful?
Thank you for your feedback!
#ServerlessTips - Azure Service Bus
Author: Steef-Jan Wiggers Azure MVP
You can leverage Azure Monitor Logs to monitor your Service bus namespace since they offer integration with them. With Azure Monitor Logs you centrally consolidate all the logs of your service bus namespace. Furthermore, you can use Log Analytics in the Azure portal and then either directly analyze the data, create queries and visualizations, and alert rules.
Setup of directing your log telemetry to Azure Monitor Logs is straight forward. You create a Log Analytics workspace first; subsequently, you go to your service bus namespace, and choose Diagnostic Settings and configure the settings.
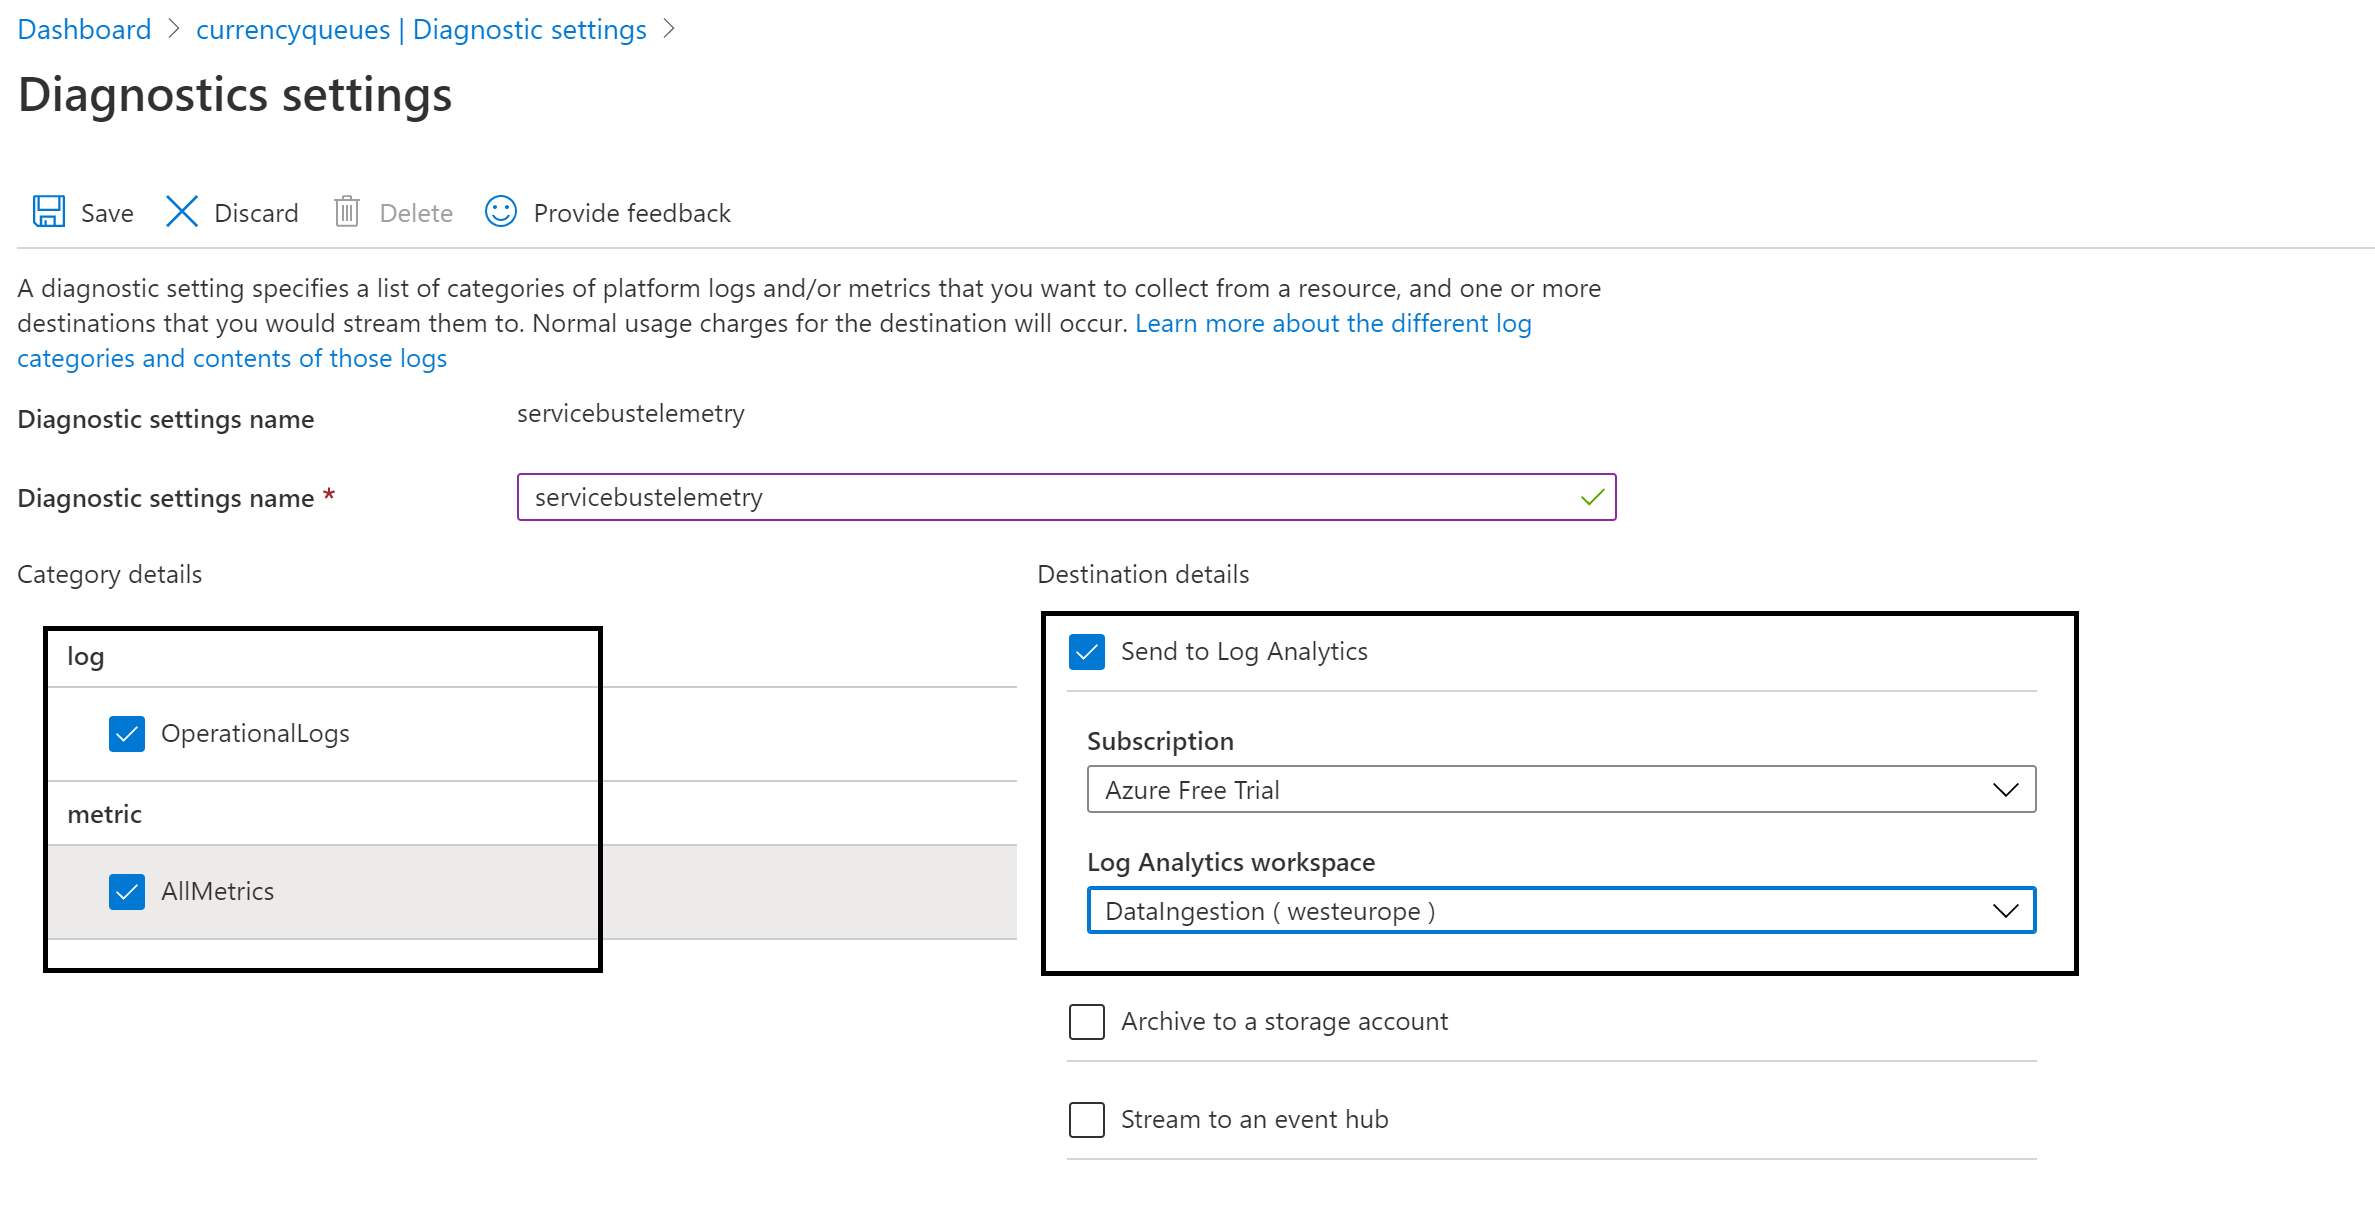
Once you have configured your diagnostic settings and send logs to the specified analytics workspace, you can access the log telemetry via Log Analytics Workspace under General. Next, you can start creating queries on the log data.
Currently, with Azure Service Bus activity and operational logs are supported – which are captured when any operation with a service bus namespace occurs. Operations such as queue or topic creation, resources used, and the status of the operation. Furthermore, the operational logs (Activity or Diagnostic) are stored in JSON format.
With diagnostics set, you can query and analyze your service bus log data. Moreover, you can gain insights into the service operation and troubleshoot quickly. The query language for Log Analytics is Kusto, and its syntax and examples are available on the Microsoft docs.
Also, get insights into Turbo360 Azure Service Bus monitoring tool on messaging issues and how you can improve them.
Was this article helpful?