Observe Service Bus Metrics in Azure Monitor
- Print
- DarkLight
- Download PDF
Observe Service Bus Metrics in Azure Monitor
- Print
- DarkLight
- Download PDF
Article summary
Did you find this summary helpful?
Thank you for your feedback!
#ServerlessTips - Azure Service Bus
Author: Steef-Jan Wiggers Azure MVP
Like many of the Azure service, you want to monitor its performance, availability, usage, and so on. Similar you can monitor Bus a variety of metrics of a Service Bus namespace. Moreover, in the overview of a service bus namespace, you can by default see the number of requests and messages.
With Azure Monitor, you have multiple ways to access Service Bus metrics. For instance, you access the metrics through the Azure portal or use or the Azure Monitor APIs (REST and .NET) and analysis solutions such as Azure Monitor logs. Through the Azure portal, you can access Azure monitor and select explore metrics, select a scope, i.e. service (service bus namespace) in a resource group where it resides. Next, choose the metric like ‘Succesful Requests’, and a Line chart (default) will appear.
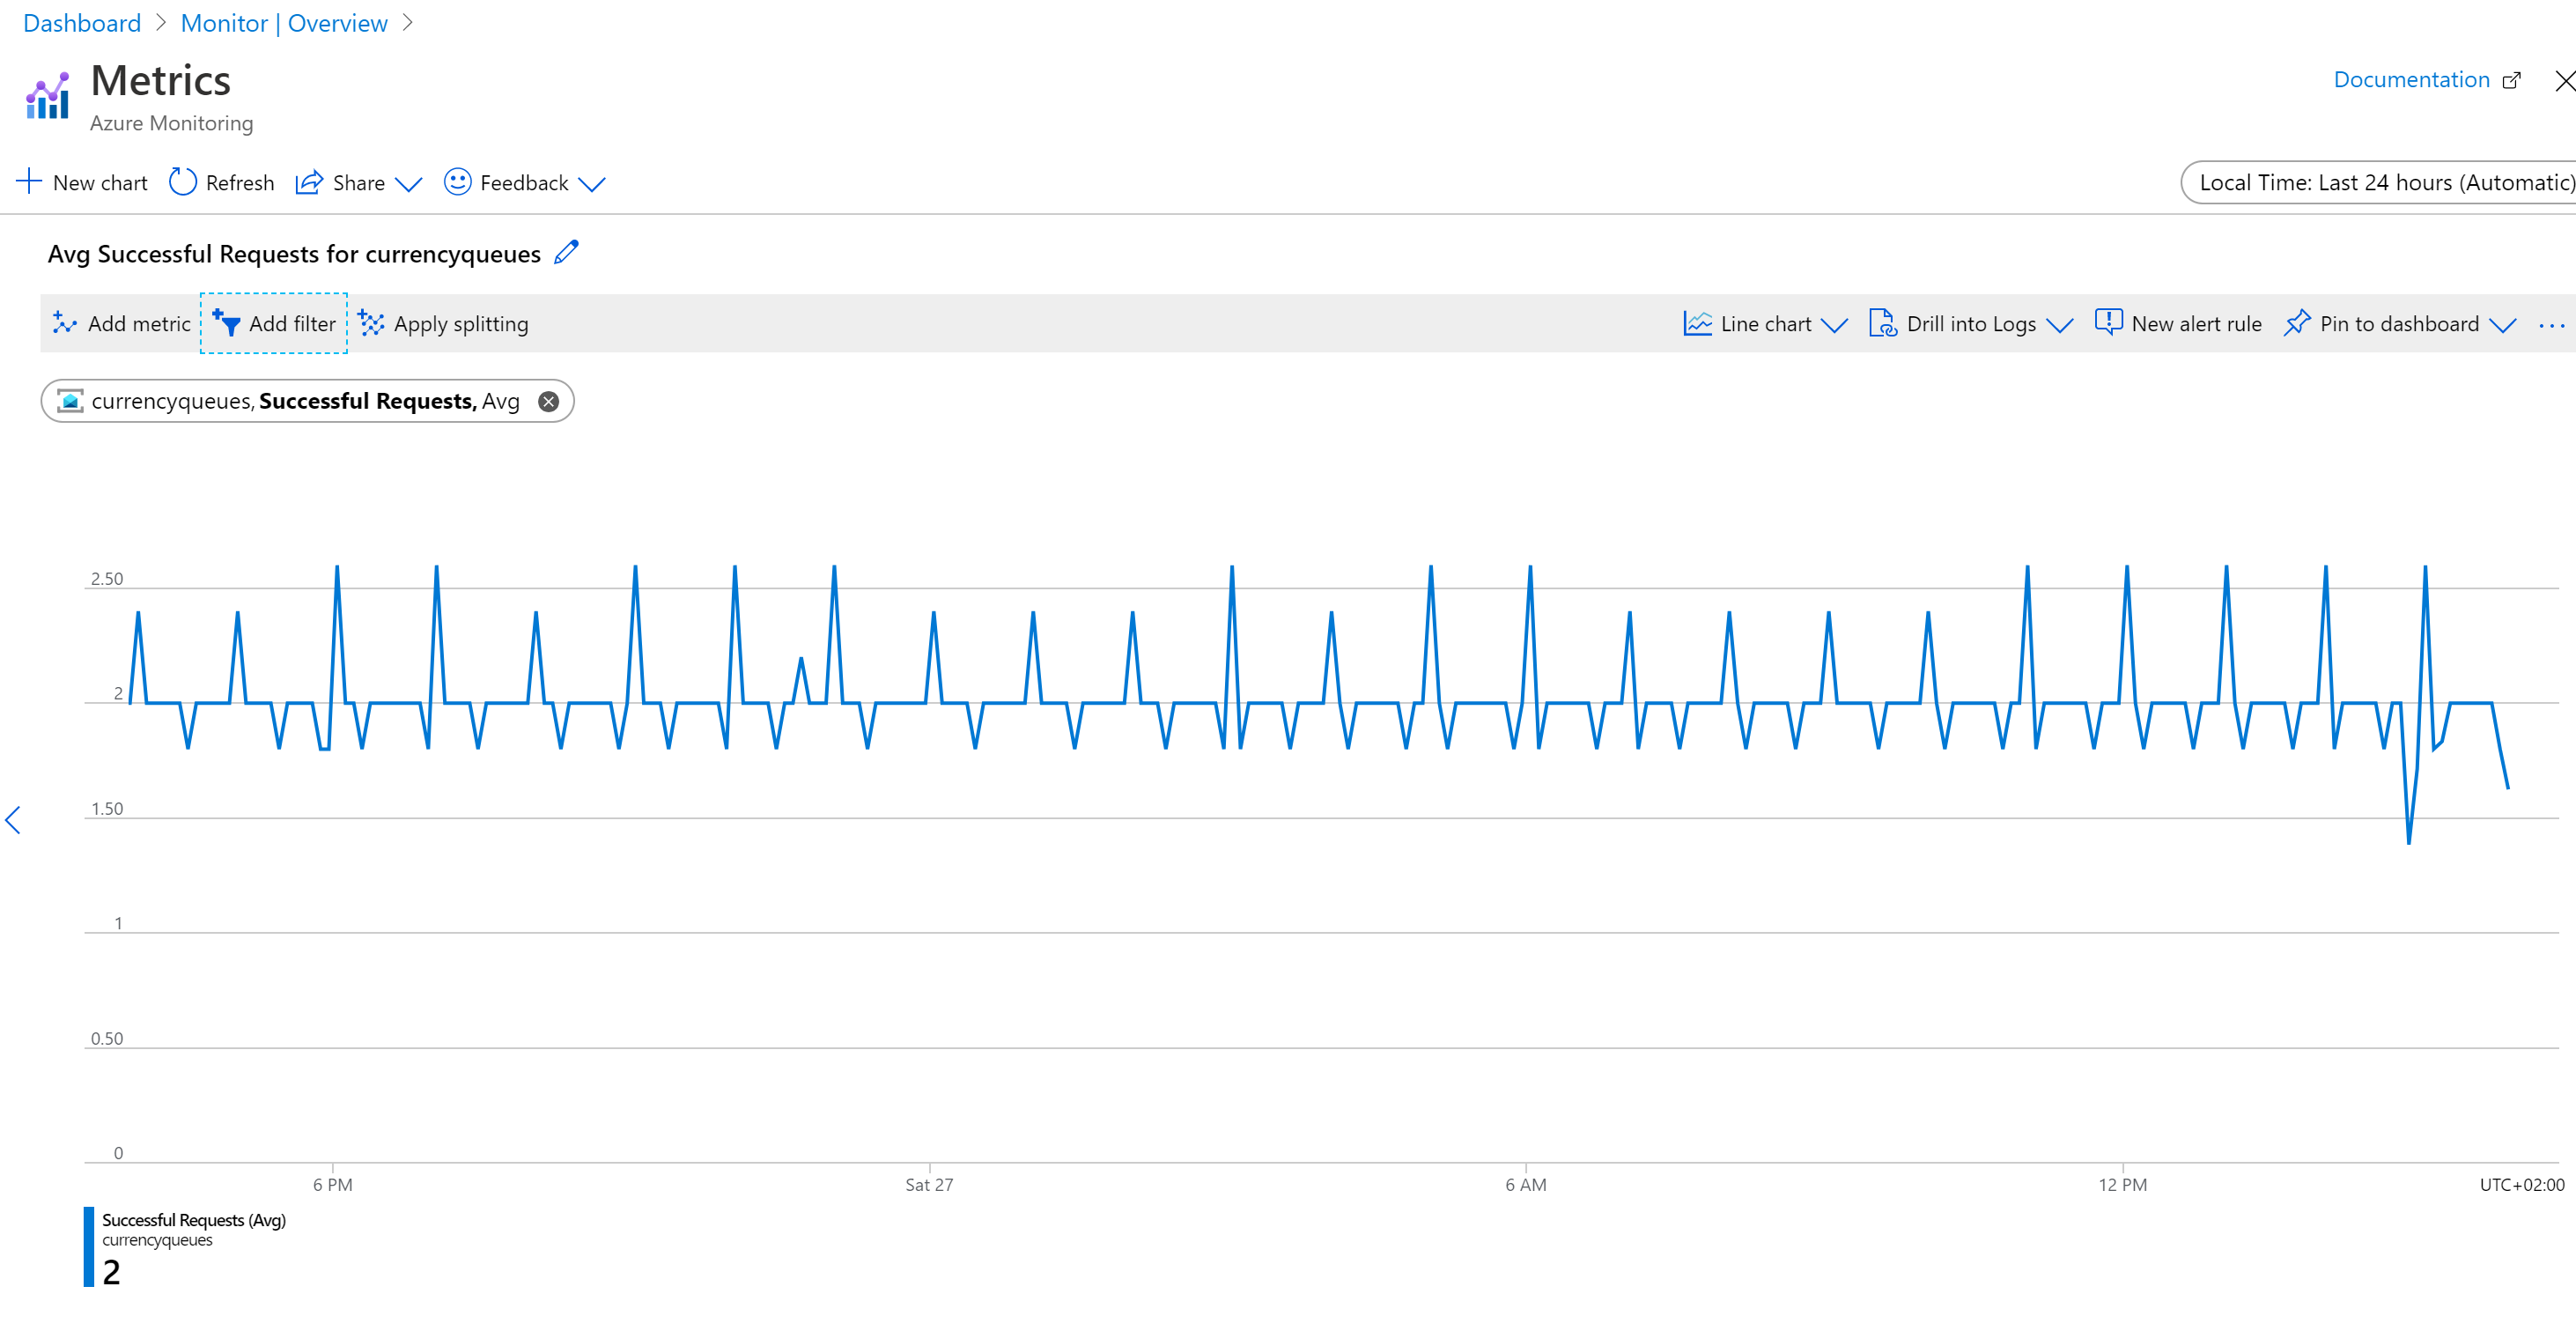
And finally, you can add filters, adjust period (up to 30 days or a custom selection), create an alert, and drill into the activity logs.
Metrics for a service bus namespace can be request metrics, message metrics, connection metrics, and resource usage metrics. You can use any of the metrics to monitor and visualize with Azure Monitor, and also query, analyze and create alerts.
Also, get insights into the messaging issues and improve Azure Service Bus monitoring.utm_source=organic_referral&utm_medium=slnotes
Was this article helpful?